Market Performance Summary
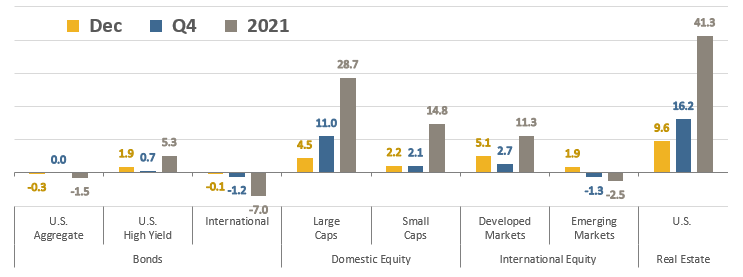
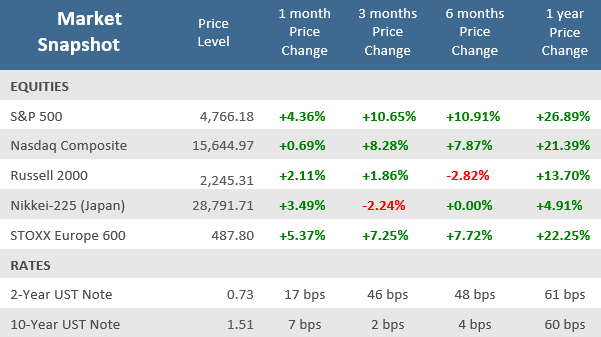
Stocks and Real Estate finished the year strongly with solid December gains. Low interest rates, plenty of liquidity, an expanding economy, and strong earnings continued to fuel the rise for equities. The S&P 500 closed the year just shy of its 70th record close reached on December 29 (and started the first day of 2022 with a record close, the most recent as of this publication date). As we show on the next page, it was the best December for U.S. stocks, as measured by the S&P 500, since 2010. The strong December capped a solid fourth quarter and calendar year 2021. The index finished the quarter with an +11% total return (including dividends), the best quarter of 2021 and just shy of 2020’s +12.1% fourth quarter total return. Only Real Estate performed better, for all three time horizons, but most other asset classes still had solid gains for the trailing month, quarter and year.
Source: Bloomberg, as of December 31, 2021. Performance figures are index total returns: U.S. Bonds (Barclays U.S. Aggregate Bond TR), U.S. High Yield (Barclays U.S. HY 2% Issuer-Capped TR), International Bonds (Barclays Global Aggregate ex USD TR), Large Caps (S&P 500 TR), Small Caps (Russell 2000 TR), Developed Markets (MSCI EAFE NR USD), Emerging Markets (MSCI EM NR USD), Real Estate (FTSE NAREIT All Equity REITS TR).
U.S. Bonds, International Bonds, and Emerging Markets equities weren’t so fortunate. Those markets had to grapple with rising inflation, and for the non-U.S. markets, a stronger U.S. dollar and less accommodative central banks were headwinds, particularly in the back half of the year. The yield on the U.S. 10-year Treasury Note rose 7 basis points (+0.07%) in December, 2 basis points (+0.02%) in Q4, and 60 basis point (+0.60%) for 2021. But the real story in December and the fourth quarter overall was the flattening of the yield curve in which short-term rates rose more than long-term rates. The yield on the U.S. 2-year Treasury Note rose 17 basis points (+0.17%) in December, 46 basis points (+0.46%) in Q4, and 61 basis point (+0.61%) for 2021. The dramatic flattening in the yield curve was the bond market showing its concern about central bank policy normalization, a potential Federal Reserve policy during that normalization, uncertainty about future economic growth, or perhaps all of the above.
Source: Bloomberg.
Quick Takes
Strong Finish, Strong Year.
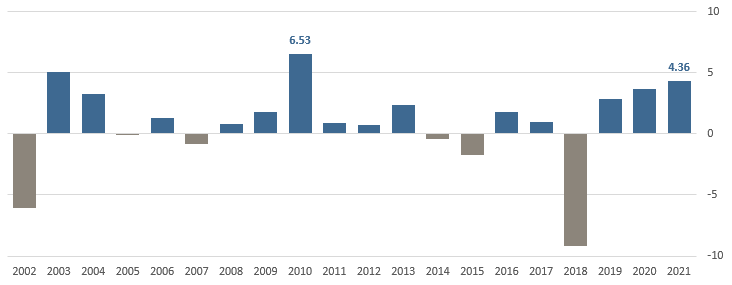
The S&P 500 returned +4.4% with dividends included in December, marking its best December since 2010 when it gained +6.5%. In fact, only one other December, in 2003, was the index higher than the +4.4% December 2021 return. That December rally pushed S&P 500 to its 70th record high in 2021, only surpassed by the 75 all-time highs in 1995, and at +28.7% total return, its second-best year since 2013 (2019 was +31.5%). December also marked the seventh consecutive positive quarter for the index, the longest stretch since the nine successive positive quarters from Q4-2015 to Q4-2017.
A December to Remember: The S&P 500 had its best December since 2010
December returns by calendar year since 2002
Source: Bloomberg.
Home Sweet Home.
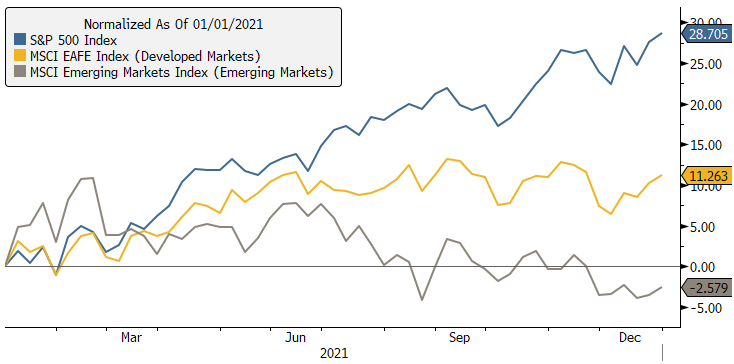
For a large percentage of retirement savers, a diversified moderate risk portfolio, generally with 60-70% of its holdings in equity asset classes, is the primary investment vehicle. For those investors, one of the biggest stories of 2021 was the breakdown of the equity portion of those portfolios. U.S. stocks have outperformed non-U.S. stocks by an extended duration and magnitude. The U.S. stock market (S&P 500) has outperformed non-U.S. stocks (MSCI EAFE) for the last four consecutive years and for 9 of the last 12 years. Over the last 12 years the S&P 500 has delivered a total cumulative return of +443.5%, while the MSCI EAFE Index (developed non-U.S. stocks) has returned +105.0% and the MSCI Emerging Markets Index returned just +65.5%. 2021 saw one of the largest performance discrepancies in years between U.S. stocks and non-U.S. stocks. The +17.4% outperformance of the S&P 500 over the MSCI EAFE was the largest since 2014.
Many Wall Street strategists called for outperformance by international stocks coming into 2021, particularly emerging markets. Not only did that not materialize, but emerging markets were the worst-performing major equity asset class during the year, and only international bonds turned in a worst year. Some of the headwinds hurting international stocks, and especially emerging markets, were the strengthening U.S. dollar, higher relative inflation, and central banks that are already hiking interest rates overseas. The strong returns of the U.S. relative to non-U.S. have resulted in lower valuations for non-U.S. markets, but until economic and earnings growth begins to outpace the U.S., it is hard to see a catalyst for the trend of U.S. outperformance to change anytime soon.
2021 Equity Performance
S&P 500 Index, MSCI EAFE, and MSCI Emerging Markets Total Returns
Source: Bloomberg.
Inflation Surges.
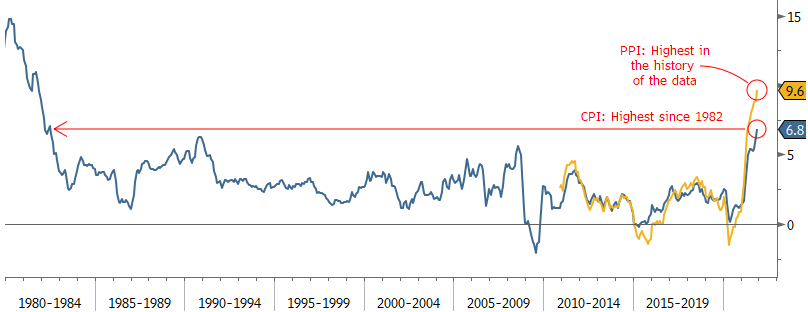
The November Consumer Price Index, or CPI which measures the cost of a wide-ranging basket of goods and services, rose at a +6.8% annual rate, which is the fastest consumer inflation rate since June 1982. Not surprisingly to most Americans, gasoline prices were a primary contributor to the jump in inflation, up +58.1% in the last year. Shelter costs, which make up a third of the CPI weighting, rose +3.8% from 2020, the highest annual increase since 2007.
Unfortunately, wholesale prices are rising even faster than consumer prices. The Producer Price Index (PPI), which are the prices that suppliers charge businesses, surged +9.6% in November from a year ago. For PPI, or the so-called the Producer Price Index for Final Demand, that’s by far the highest rate for data that goes back to 2010. The upward revisions for the past month suggest inflation is running hotter than realized. Bloomberg economists expect inflation to further accelerate into early next year. Household consumption is also surprisingly robust. The combination of higher inflation risks and consumer resiliency means that the likelihood of the Fed accelerating the taper of its asset purchases has increased and that rates hikes may come sooner than expected.
Inflation Surges to Decade Highs
Consumer and Producer Inflation (year-over-year % change)
Source: Bloomberg.
Covid Cases Surge.
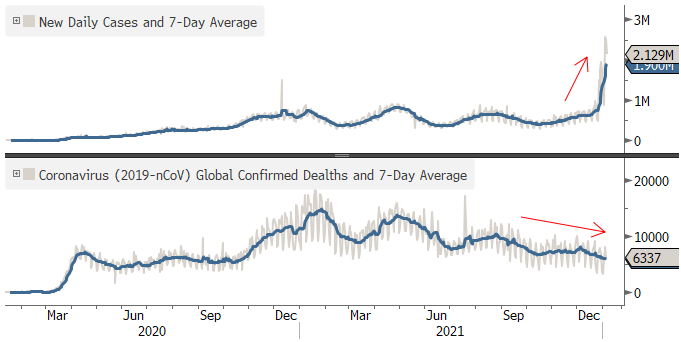
The emergence of the highly infectious Omicron variant led to a massive surge in reported COVID cases in the U.S. and globally, but data from South Africa and the UK indicated a much lower level of severity of the disease. As a result, confirmed fatalities have continued to moderate and are well below the late January 2021 peak. In fact, deaths are now back to levels last seen in October of 2020. The rapid increase in infections due to seasonality and the new Omicron variant brought more volatility to financial markets in December but investors appeared to become less concerned in late December as the deaths continued to decline even while cases soared. Indeed, Consumer Confidence rose to the highest level in six months as the ‘expectation’ component hit its highest level since July despite the rapid rise in inflation and new COVID cases.
Global Daily Virus Cases Surge but Deaths Fade
New Daily Cases and Deaths with 7-Day Moving Averages
Source: Bloomberg and Johns Hopkins University.
Wanna Get Away?
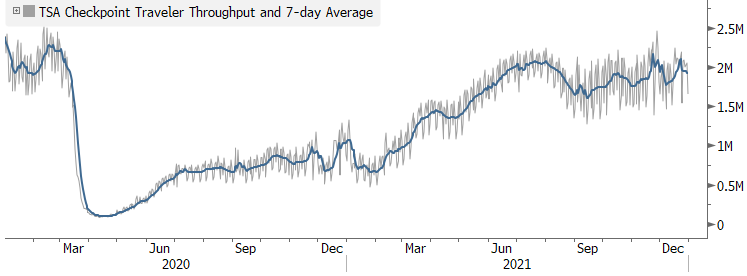
Confirming the Conference Board Consumer Confidence improvement and its ‘Expectations’ subcomponent, travelers have largely stuck to their plans in the face of the spiking COVID cases. Travel hasn’t quite fully recovered to pre-pandemic levels, but airline activity appeared nearly as busy during the Christmas holiday as Thanksgiving, when daily passenger volumes hit their highest levels since the start of the pandemic. TSA checkpoint activity supports this.
Volatility… the New Normal?
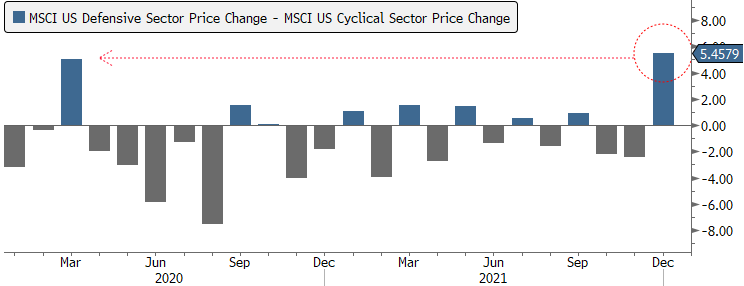
As discussed last month volatility in both the equity and bond markets increased in the fourth quarter. In December, the Fed has confirmed that it will accelerate the tapering of its asset purchase program and now most Fed officials are expecting 3 rate hikes. That, in conjunction with the pesky inflation pressures as well as the rapidly spreading Omicron variant, has the markets more jittery than they’ve been all year. Sharp, rapid, and episodic swings up and down have some investors losing conviction despite most major indices still in striking distance of all-time highs. Given the uncertainty about the timing and path of the Fed’s new hawkish pivot to a tightening cycle, it is entirely likely that big flip-flops may persist into the new year path. This is especially the case for those sectors of the market with the most stretched valuations and that have had the most outsized returns in the aftermath of the pandemic. December saw technology stocks, growth-oriented stocks suffer bigger drawdowns value, defensive, and low volatility styles. The S&P 500 Low Volatility Index just had its best one-month total return since January 1987 with a +9.7% return and, as shown below, defensive stocks had their best month against cyclical stocks since the depths of the pandemic in March 2020.
Flight to Safety
Defensive Sectors had their best month versus Cyclical Sectors since Mar 2020
Source: Bloomberg.
Can it Continue?
According to the Wall Street Journal, Wall Street strategists are forecasting smaller gains for the S&P 500 in 2022. Among 13 banks and financial services firms whose analysts have published 2022 forecasts, the average target for the S&P 500 to end 2022 is 4,940, about +4% above where the index closed 2021. On the high end of next year’s projections, strategists at BMO Capital Markets are forecasting the S&P 500 will finish 2022 at 5300, about a +11% gain. The BMO team expects company earnings growth will help push stocks higher. Profits at large U.S. companies are expected to continue growing next year, though at a slower pace than this year’s surge. Analysts estimate that earnings from S&P 500 companies will rise +9.2% in 2022, according to FactSet, down from the predicted +45% profit growth in 2021.
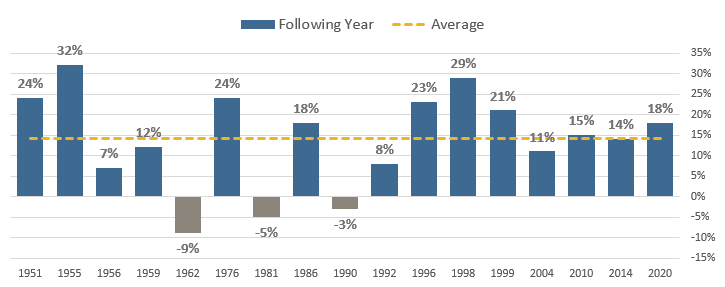
If history is any guide, just because the S&P 500 had a big up year doesn’t mean it can’t continue with solid returns in subsequent years. Since 1950 there have been 17 years when the S&P 500 was up +25% or more. In 14 of those years, the following year was also positive, by an average of +14%. Past performance never guarantees future results, but with a healthy economy still expanding and expectations for continued earnings growth, there is a good foundation for the bull market to continue.
Looking Good from A Historical Perspective
S&P 500 total returns following +25% or more up years
Source: Truist IAG, FactSet Study based on total returns dividends).
Past performance does not guarantee future results
Asset Class Performance
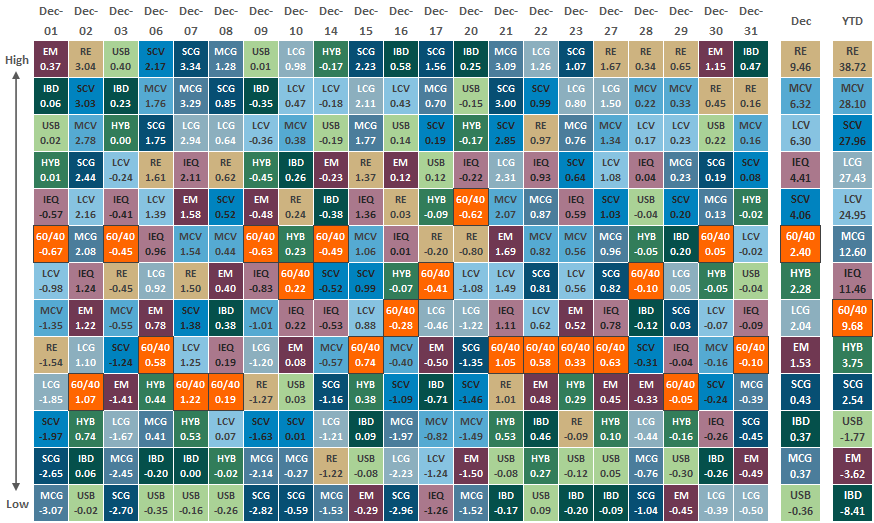
The Importance of Diversification
Diversification mitigates the risk of relying on any single investment and offers a host of long-term benefits, such as lowering portfolio volatility, improving risk-adjusted returns, and helping investments to compound more effectively.
Source: Bloomberg. Asset‐class performance is presented by using market returns from an exchange‐traded fund (ETF) proxy that best represents its respective broad asset class. Returns shown are net of fund fees for and do not necessarily represent performance of specific mutual funds and/or exchange-traded funds recommended by The Retirement Planning Group. The performance of those funds may be substantially different than the performance of the broad asset classes and to proxy ETFs represented here. U.S. Bonds (iShares Core U.S. Aggregate Bond ETF); High‐Yield Bond (iShares iBoxx $ High Yield Corporate Bond ETF); Intl Bonds (SPDR® Bloomberg Barclays International Corporate Bond ETF); Large Growth (iShares Russell 1000 Growth ETF); Large Value (iShares Russell 1000 Value ETF); Mid Growth (iShares Russell Mid-Cap Growth ETF); Mid Value (iShares Russell Mid-Cap Value ETF); Small Growth (iShares Russell 2000 Growth ETF); Small Value (iShares Russell 2000 Value ETF); Intl Equity (iShares MSCI EAFE ETF); Emg Markets (iShares MSCI Emerging Markets ETF); and Real Estate (iShares U.S. Real Estate ETF). The return displayed as “Allocation” is a weighted average of the ETF proxies shown as represented by: 30% U.S. Bonds, 5% International Bonds, 5% High Yield Bonds, 10% Large Growth, 10% Large Value, 4% Mid Growth, 4% Mid Value, 2% Small Growth, 2% Small Value, 18% International Stock, 7% Emerging Markets, 3% Real Estate.
Chris Bouffard is CIO of The Retirement Planning Group (TRPG), a Registered Investment Adviser. He has oversight of investments for the advisory services offered through TRPG.
Disclaimer: Information provided is for educational purposes only and does not constitute investment, legal or tax advice. All examples are hypothetical and for illustrative purposes only. Past performance of any market results is no assurance of future performance. The information contained herein has been obtained from sources deemed reliable but is not guaranteed. Please contact TRPG for more complete information based on your personal circumstances and to obtain personal individual investment advice.

