Quick Takes
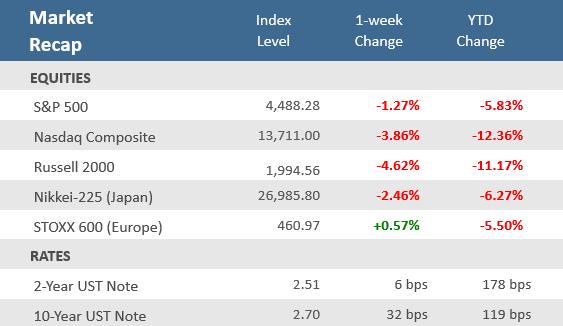
- The major U.S. stock indexes ended the week with losses breaking multi-week win streaks. Small caps, growth, and technology were particularly hard hit as yields climbed higher with markets bracing for tighter monetary policy.
- The 10-year U.S. Treasury yield rose for six consecutive days, climbing 32 basis points, while the 2-year Treasury was 6 basis points higher. That resulted in the yield curve steepening and un-inverting from the negative spread that market watchers had been discussing heavily.
- Several Federal Reserve officials made the rounds at speaking engagements during the week, and in conjunctions with release of the March Fed policy meeting minutes, reiterated that the Fed was willing and ready to raise interest rates and unwind its balance sheet more quickly than market participants had expected.
Three and Out for Stocks, While Yields Climb Higher
The equity markets continued their choppy trading, giving back some of the gains from their recent rally off the March 8 lows. The S&P 500 slid -1.3% while the Nasdaq Composite and Russell 2000 fell harder with -3.9% and -4.6% declines, respectively. A rotation to defensive sectors helped healthcare, staples and utilities gain over the week, while technology, consumer discretionary, and industrials lagged.
A bevy of Federal Reserve officials were on the speaking tour over the week, headlined by Fed governor Lael Brainard—who is a nominee for vice chair—who said reducing elevated inflation is of “paramount importance.” She and other Fed heads corroborated Wednesday’s release of the minutes from the Fed policy meeting in March that suggested a series of rate hikes and the beginning of reducing its balance sheet at a “rapid pace” as soon as the May meeting. Those actions include the potential for multiple rate hikes of 50 basis points (bps), which would be the first time it raised rates in excess of its traditional 25 bps incremental increases in over 20 years. The more aggressive than expected Fed tone pushed bond yields up, with the benchmark 10-year note yield closing at 2.70% on Friday, the highest level since March 2019. The 2-year Treasury was also up, rising 6 bps over the week, meaning the 2-year / 10-year yield curve is no longer inverted, i.e. the yield on the 10-year returned to being higher than the 2-year yield. The brief 3-day period of the 2-year yield exceeding the 10-year yield sparked a lot of discussion about it projecting a recession, but the inversion was so short, and not confirmed by the older, and more reliable 3-month / 10-year yield curve, which has been climbing higher in 2022.
The markets continue to contend with the ongoing Russia-Ukraine war. The European Union and the United States have tightened sanctions against Russia as the conflict continued. Russia’s retreat from areas surrounding Kyiv prompted multiple charges of atrocities, which Russia denied. On Thursday, the House of Representatives and Senate passed bills stripping Russia of its Most Favored Nation trading status and banned imports of oil from Russia, which President Joe Biden is expected to sign. The UN General Assembly removed Russia from the Human Rights Council.
Chart of the Week
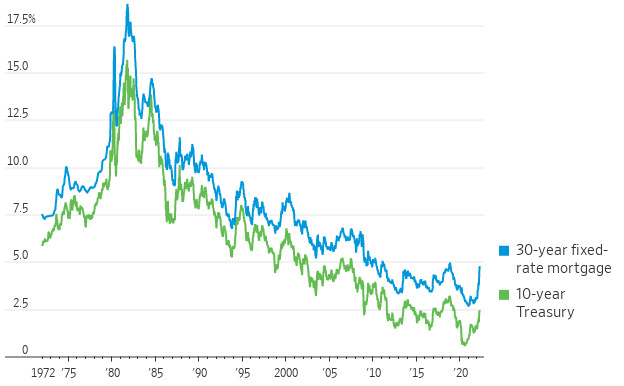
Mortgage rates keep climbing higher. According to Freddie Mac, the average rate for a 30-year fixed-rate home loan edged up to 4.72%, the highest it’s been since December 2018. That is up from 3.22% at the start of this year and up from its record low of 2.65% just a little over a year ago, in January 2021. The swell in yields is unlikely to reverse any time soon. A number of Federal Reserve officials intimated that they could raise interest rates by a half-percentage point at the upcoming May FOMC meeting. As shown in the Chart of the Week, mortgage rates move closely with the 10 -year U.S. Treasury yield, which are now at their highest levels in three years.
Climbing Higher
U.S. mortgage rates vs. Treasury yields, weekly
Source: Federal Reserve, Freddie Mac via St. Louis Fed, The Wall Street Journal.
Economic Review
- February Factory Orders slid -0.5%, slightly better than expectations for a -0.6% decline, and well off the prior month’s upwardly revised +1.5% (from +1.4%). Durable Goods Orders were revised higher to -2.1% from the preliminarily report two weeks ago.
- The March ISM Services Purchasing Managers Index (PMI) reported that expansion accelerated in the key services sector, with the index rising to 58.3 from 56.5 in February, but at a slightly lower rate than the expected 58.5 (levels above 50 indicate expansion). Growth in new orders, business activity, and employment increased month-over-month, and employment crossed into expansion territory. New export orders jumped, inventories rose, and prices paid ticked further above 80.
- The final March S&P Global Services PMI Index was unexpectedly revised lower to 58.0 from the preliminary 58.9 level, where it was expected to remain. That is still above February’s reading of 56.5 (levels above 50 represents expansion).
- The weekly MBA Mortgage Application Index declined -6.3% last week, following the prior week’s decrease of –6.8%, marking the fourth-straight weekly decline. The Refinance Index fell -9.9% and the Purchase Index slid -3.4%. The average 30-year mortgage rate jumped +30 bps to 4.80% and is up +1.47% versus a year ago.
- Weekly unemployment claims unexpectedly fell by 15,000 to 166,000 —the lowest since 1968— versus estimates of 200,000 and the prior week’s downwardly revised 171,000. Continuing claims, a proxy for the total number of people on unemployment rolls through regular state programs, increased by 17,000 to 1,523,000, above estimates of 1,302,000.
The Week Ahead
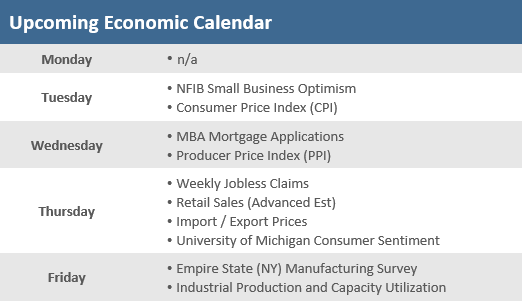
In a light week of economic data, the primary focus will be on consumer inflation (CPI) on Tuesday and producer inflation (PPI) on Wednesday, as well as Consumer Sentiment on Thursday. Investors will be watching earnings season, which will kick off during the week with reports from five big banks. JPMorgan will report before the bell on Wednesday. Citigroup, Goldman Sachs, Morgan Stanley and Wells Fargo will report before markets open on Thursday. The U.S. equity and bond markets will be closed on Good Friday next week.
Did You Know?
TEN PLUS – The average US single-family home has appreciated at least +10% in just 4 of the last 30 years (1992-2021). The double-digit years were 2004, 2005, 2020, and 2021 (source: Federal Housing Finance Agency, BTN Research).
PLANNING AHEAD – 22% of 1,061 pre-retirees (i.e., Americans still in the workforce) surveyed in June 2021 updated their estate planning documents since the pandemic began in the 1st quarter 2020 (source: Society of Actuaries 2021 Retirement Risk Survey, BTN Research).
A LOT OF SPENDING – President Biden’s 10-year budget proposal released on 3/28/2022 forecast fiscal year 2023 (i.e., the 12 months beginning 10/01/2022) tax receipts of $4.64 trillion, outlays of $5.79 trillion, netting to a $1.15 trillion deficit. Biden’s proposal anticipates annual budget deficits of at least $1.15 trillion for each of the next 10 years, adding up to $14.4 trillion of deficit spending over the decade 2023-2032 (source: White House, BTN Research).
This Week in History
Makeover – On April 6, 1988, the S&P 500 Index was overhauled. Instead of being made up of 400 industrial stocks, 40 utilities, 40 financial stocks and 20 transportation issues, its industry weights began to float freely, so that stocks from all sectors were represented by market value (source: The Wall Street Journal).
Asset Class Performance
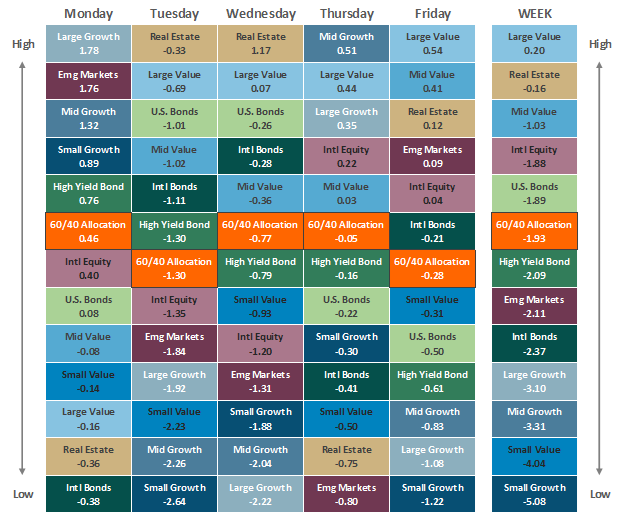
The Importance of Diversification. Diversification mitigates the risk of relying on any single investment and offers a host of long-term benefits, such as lowering portfolio volatility, improving risk-adjusted returns, and helping investments to compound more effectively.
Source: Bloomberg. Asset‐class performance is presented by using market returns from an exchange‐traded fund (ETF) proxy that best represents its respective broad asset class. Returns shown are net of fund fees for and do not necessarily represent the performance of specific mutual funds and/or exchange-traded funds recommended by The Retirement Planning Group. The performance of those funds may be substantially different than the performance of the broad asset classes and to proxy ETFs represented here. U.S. Bonds (iShares Core U.S. Aggregate Bond ETF); High‐Yield Bond (iShares iBoxx $ High Yield Corporate Bond ETF); Intl Bonds (SPDR® Bloomberg Barclays International Corporate Bond ETF); Large Growth (iShares Russell 1000 Growth ETF); Large Value (iShares Russell 1000 Value ETF); Mid Growth (iShares Russell Mid-Cap Growth ETF); Mid Value (iShares Russell Mid-Cap Value ETF); Small Growth (iShares Russell 2000 Growth ETF); Small Value (iShares Russell 2000 Value ETF); Intl Equity (iShares MSCI EAFE ETF); Emg Markets (iShares MSCI Emerging Markets ETF); and Real Estate (iShares U.S. Real Estate ETF). The return displayed as “Allocation” is a weighted average of the ETF proxies shown as represented by: 30% U.S. Bonds, 5% International Bonds, 5% High Yield Bonds, 10% Large Growth, 10% Large Value, 4% Mid Growth, 4% Mid Value, 2% Small Growth, 2% Small Value, 18% International Stock, 7% Emerging Markets, 3% Real Estate.
Chris Bouffard is CIO of The Retirement Planning Group (TRPG), a Registered Investment Adviser. He has oversight of investments for the advisory services offered through TRPG.
Disclaimer: Information provided is for educational purposes only and does not constitute investment, legal or tax advice. All examples are hypothetical and for illustrative purposes only. Past performance of any market results is no assurance of future performance. The information contained herein has been obtained from sources deemed reliable but is not guaranteed. Please contact TRPG for more complete information based on your personal circumstances and to obtain personal individual investment advice.


