Quick Takes
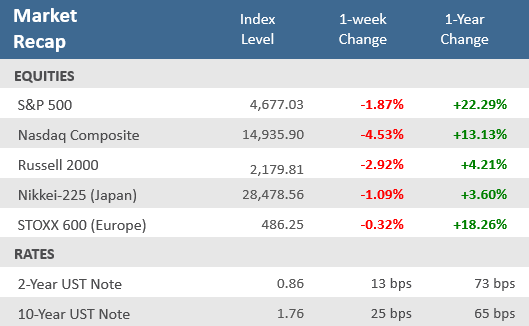
- Surging yields rattled markets in the first week of trading in the new year. The S&P 500 dropped -1.9% despite hitting a record high on the first day of the year. The technology-heavy Nasdaq Composite was hit especially hard, falling -4.5% over the week.
- The yield on the U.S. 10-year Treasury note spiked to 1.76% from 1.51%, its highest level since the pandemic. The Bloomberg Aggregate Bond Index fell -1.5% over the week, its biggest weekly decline since March 2020 at the depths of the pandemic.
- The December Employment Report showed the U.S. economy added 199,000 jobs, less than half of what economists expected. However, the unemployment rate fell more than expected, to 3.9% versus the 4.1% forecasted.
Financial markets hung over in 2022’s first week of trading
The S&P 500 and Dow Jones Industrial Average both hit record highs on the first trading day of the new year, but that was about the extent of gains thus far in the new year. For the remainder of the week, U.S. stocks gave back some of the solid gains registered in 2021. The markets were choppy on Tuesday, but it was the midweek release of the Fed’s December meeting minutes that set markets reeling. The Fed’s December monetary policy meeting minutes suggested that the Fed could be much more aggressive in their monetary tightening policy than initially expected, including a sooner-than-expected reduction of its massively expanded balance sheet. Bond markets also disliked the Fed meeting minutes as the Treasury yield curve steepened noticeably after its release. The yield on the U.S. 10-year Treasury note spiked to 1.76% from 1.51%, its highest level since the pandemic. The 25-basis point (0.25%) one-week increase was the largest weekly gain since September 2019. The Bloomberg Aggregate Bond Index fell -1.5% over the week, its biggest weekly decline since March 2020 at the depths of the pandemic.
The surge in yields also took a toll growth-oriented stocks like Information Technology and Communications Services. As a result, the Nasdaq Composite Index fell -4.5% on the week, its worst week since February 2021. Markets may be pricing in too much Fed tightening given that inflation may be peaking, Omicron wasn’t spiking when the Fed held its December meeting, and the fall brings the mid-term elections. Any of those could give the Fed reason to be extra deliberative about its path to normalization and a combination of them would make it difficult for the Fed to be overly aggressive in tightening if the economy is already slowing in the second half of the year.
Chart of the Week
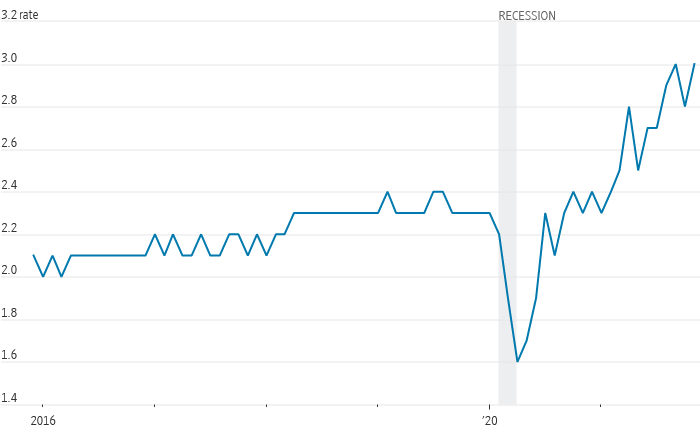
The Job Openings and Labor Turnover Survey (JOLTS), a measure of unmet demand for labor, showed that workers quit their jobs at a record rate in November while job openings stayed close to highest-ever levels. The Labor Department reported 10.6 million job openings at the end of November, a decrease from 11 million the prior month. The total number of quits reached 4.53 million. That represented an 8.9% increase from October and broke September’s high-water mark of 4.36 million. As a percentage of the workforce, the quits rate was 3%, up from 2.8% the prior month, which returned it to the record rate if first set in September. The report showed the hiring rate increased slightly to 4.5% from October’s 4.4% level, and separations advanced to 4.2% from the prior month’s 4.0% pace.
Take this job and…
U.S. quits rate, total nonfarm payrolls
Source: Labor Department via St Louis Fed. Seasonally adjusted.
Economic Review
- The December Employment Report showed the U.S. economy added far fewer jobs than expected in December. Nonfarm payrolls grew by 199,000, less than half of the 450,000 that economist polled by Bloomberg had expected and below November’s upwardly revised 249,000. However, the unemployment rate fell to 3.9%, better than the 4.1% expected by economists and the 4.2% in November. The labor force participation rate remained at November’s upwardly revised 61.9% figure, in line with forecasts. Average hourly earnings increased +0.6%, above expectations to match of November’s upwardly revised +0.4% rise. Year-over-year wages were +4.7% higher, above forecasts for a +4.2% rise.
- On Wednesday afternoon, the Fed released the FOMC Meeting Minutes from its December monetary policy meeting—at which it had announced that it will double the pace of tapering its monthly asset purchases and may raise rates three times this year. The FOMC meeting minutes showed Federal Reserve officials considered a faster timetable for raising interest rates, potentially as soon as in March, because of increasing concerns with high inflation and a very tight labor market. Some officials also thought the Fed should start shrinking its $8.76 trillion portfolio of bonds and other assets relatively soon after beginning to raise rates. While the participants noted that could warrant a faster pace of normalization, they also stressed that “the decision to initiate runoff would be data dependent”.
- U.S. Construction Spending rose for a ninth straight month in November, up +0.4%, which fell below expectations of +0.6% but matched October’s upwardly revised gain. Residential spending increased +0.9% and non-residential spending was flat. Year-over-year total spending was up +9.3%.
- The December ISM Manufacturing PMI Index showed manufacturing growth continued, but fell to its lowest level since early 2021, with a drop to 58.7 from 61.1 in November, well below estimates of 60.0. The decline came as prices paid cooled significantly, falling to 68.2 from 82.4 the prior month, an indication that supply chain issues may be easing. New orders, production, and inventories saw modest declines, while employment rose. The ISM Services PMI Index plunged -7.1 points to 62.0 in December, well below estimates of 68.0. That was the biggest drop since the record plunge observed in April 2020 (-12 points).
- Meanwhile the separate Markit U.S. Manufacturing PMI Index was revised slightly lower to 57.7 from the preliminary 57.8 level, matching expectations but below November’s reading of 58.3 (reading above 50 denote economic expansion). The final Composite PMI Index was unexpectedly revised higher to 57.6 from the preliminary 57.5 level, where it was forecasted to remain, but below November’s reading of 58.0. The rise in new orders was the fastest for five months.
- The ADP Employment Change Report showed private sector payrolls rose by 807,000 jobs in December, far above expectations for a 410,000 gain. November’s rise of 534,000 jobs was revised lower to a 505,000 increase.
- Wards Auto reported light Vehicle Sales for December at a 12.44 million annual rate (seasonally adjusted), down -3.2% from the November sales rate, and down -23.7% from December 2020.
- Weekly unemployment claims rose 7,000 to 207,000, above expectations for 195,000, which was what the prior week’s upwardly revised level came in at. Continuing rose 36,000 to 1,745,000.
The Week Ahead
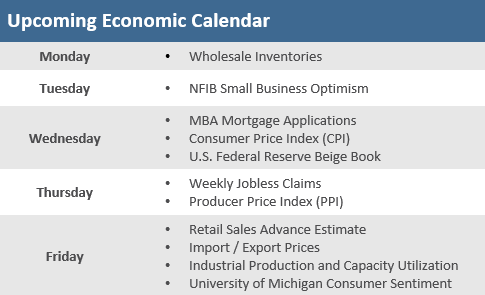
The economic calendar next week is relatively light in volume but still brings some weighty reports, including a look at December inflation from the Consumer Price Index (CPI), the Producer Price Index (PPI), and the Import Price Index. Business and consumer sentiment reports will also be released, along with a view of U.S. consumer activity from the December retail sales report.
Did You Know?
LONG-TERM — The S&P 500 has gained an average of +11.1% per year (total return) over the last 50 years (i.e., 1972-2021). The index has been positive in 17 of the last 19 years. Over the long-term, the S&P 500 has been up during 40 of the last 50 years, i.e., 80% of the time (source: BTN Research).
RARE MISS — The Bloomberg Barclays US Aggregate Bond Index was down -1.5% in 2021 (total return) but has averaged gains of +6.9% per year (total return) over the last 45 years (1977-2021). 2021 was just the 4th down year for bonds in the last 45 years. The “down” years were 1994, 1999, 2013 and 2021 (source: BTN Research).
TURKEY: HOLD MY BEER — Last month, U.S. inflation—as measured by the Consumer Price Index (CPI)—hit its highest level since 1982 with a +6.8% annual rise. But Turkey reported an annual inflation increase of +36.1%! That’s up from +21.3% in November, the Turkish Statistical Institute reported—their highest inflation rate since 2002 (source: The Wall Street Journal).
This Week in History
On January 3, 1977, Steve Jobs and Steve Wozniak incorporated Apple Computer Corp. At time, the S&P 500 was trading at around 107.0 and the Dow Jones Industrial Average was trading at 999.75. The company had its IPO in 1980, trading on the Nasdaq market under the ticker AAPL. Today, Apple is the largest company in the S&P 500 and with a market cap of $2.9 trillion. (source: Benzinga).
Asset Class Performance
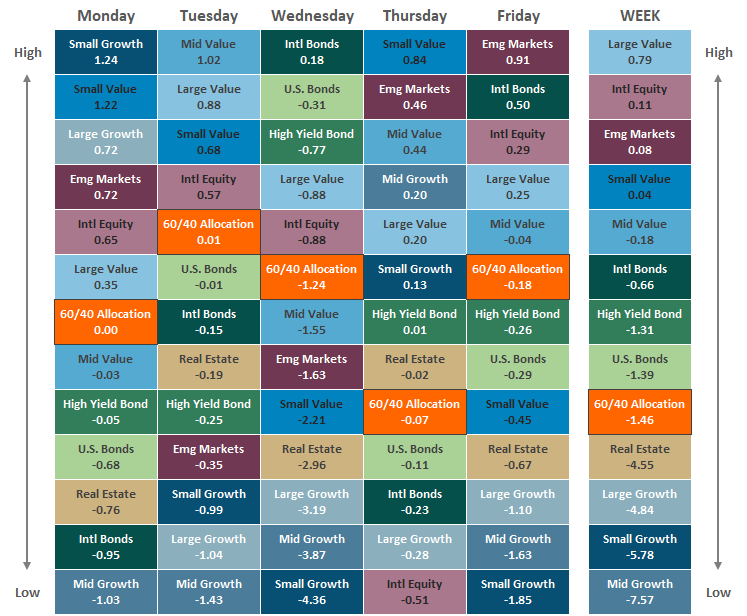
The Importance of Diversification. Diversification mitigates the risk of relying on any single investment and offers a host of long-term benefits, such as lowering portfolio volatility, improving risk-adjusted returns, and helping investments to compound more effectively.
Source: Bloomberg. Asset‐class performance is presented by using market returns from an exchange‐traded fund (ETF) proxy that best represents its respective broad asset class. Returns shown are net of fund fees for and do not necessarily represent the performance of specific mutual funds and/or exchange-traded funds recommended by The Retirement Planning Group. The performance of those funds may be substantially different than the performance of the broad asset classes and to proxy ETFs represented here. U.S. Bonds (iShares Core U.S. Aggregate Bond ETF); High‐Yield Bond (iShares iBoxx $ High Yield Corporate Bond ETF); Intl Bonds (SPDR® Bloomberg Barclays International Corporate Bond ETF); Large Growth (iShares Russell 1000 Growth ETF); Large Value (iShares Russell 1000 Value ETF); Mid Growth (iShares Russell Mid-Cap Growth ETF); Mid Value (iShares Russell Mid-Cap Value ETF); Small Growth (iShares Russell 2000 Growth ETF); Small Value (iShares Russell 2000 Value ETF); Intl Equity (iShares MSCI EAFE ETF); Emg Markets (iShares MSCI Emerging Markets ETF); and Real Estate (iShares U.S. Real Estate ETF). The return displayed as “Allocation” is a weighted average of the ETF proxies shown as represented by: 30% U.S. Bonds, 5% International Bonds, 5% High Yield Bonds, 10% Large Growth, 10% Large Value, 4% Mid Growth, 4% Mid Value, 2% Small Growth, 2% Small Value, 18% International Stock, 7% Emerging Markets, 3% Real Estate.
Chris Bouffard is CIO of The Retirement Planning Group (TRPG), a Registered Investment Adviser. He has oversight of investments for the advisory services offered through TRPG.
Disclaimer: Information provided is for educational purposes only and does not constitute investment, legal or tax advice. All examples are hypothetical and for illustrative purposes only. Past performance of any market results is no assurance of future performance. The information contained herein has been obtained from sources deemed reliable but is not guaranteed. Please contact TRPG for more complete information based on your personal circumstances and to obtain personal individual investment advice.


