Quick Takes
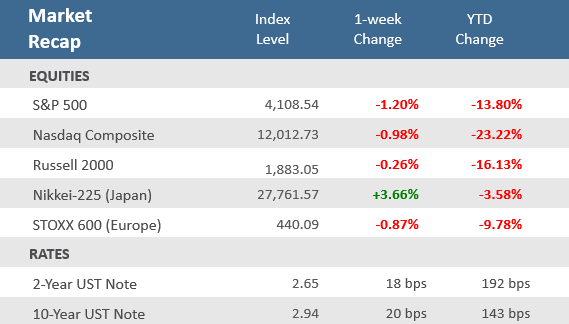
- Markets couldn’t follow up the prior week’s big gains despite a big rally on Thursday and decent economic data. The S&P 500, the Nasdaq, and the Russell 2000 all finished negative on the holiday-shortened week.
- Over the past week, yields have broken out with solid moves higher towards the cycle highs. The yield on the US 10-year Treasury note rose 0.20% to 2.94% as Fed Vice Chair Lael Brainard said that it is too early to say that inflation has peaked.
- The May employment report, released Friday morning, came in stronger than expected with Nonfarm Payrolls rising by 390,000 jobs over the month. The Unemployment Rate remained at 3.6% for the third straight month, versus expectations for it to slip to 3.5%.
Strong employment data can’t keep stocks afloat
Stocks couldn’t keep their winning ways from the prior week, as the S&P 500, the Nasdaq, and the Russell 2000 all finished negative on the holiday-shortened week. The S&P 500 fell 1.2% this week, while the Dow and the Nasdaq each lost nearly 1%. Markets rallied nicely on Thursday but then gave up those gains on Friday as investors decided the better-than-expected May employment report, released Friday morning, meant the Federal Reserve won’t back off its plans for aggressive monetary tightening. The Energy sector continues to be the clear outperformer, as all other sectors fell in the week. Other economic data during the week was generally good, with a better-than-expected acceleration in the ISM Manufacturing Index, a smaller-than-expected decline in Consumer Confidence, and lower-than-expected initial jobless claims.
Over the past week, yields have broken out with solid moves higher toward the cycle highs. The yield on the US 10-year Treasury note rose 0.20% to 2.94% as Fed Vice Chair Lael Brainard said that it is too early to say that inflation has peaked. The Vice Chair indicated that if demand does not cool, then it might be appropriate to keep hiking at the half-point pace that the Fed has said it will follow at its next two meetings. She rejected the idea of a pause in the central bank’s tightening cycle in September, saying that “we’ve got a lot of work to do to get inflation down to our 2% target.” That and the hotter-than-expected economic data pushed bond prices lower (bond prices move opposite of yields) and the Bloomberg U.S. Aggregate Bond Index fell -0.9% over the week.
With all but 5 companies in the S&P 500 having now reported Q1-2022 earnings, Refinitiv expects year-over-year earnings growth to be +11.3%. Of those that have reported, 77.4% beat analysts’ expectations, well above the long-term average of 66%. The S&P 500 is now -13.8% below its all-time high, set on January 4th, but analysts so far aren’t lowering their estimates for earnings. Bespoke Investment Group reports that aggregate forward earnings per share estimates for the S&P 500 have continued to rise and are up +7% on a year-to-date basis to 134.9, a record high. With stock prices down and earnings rising, the trailing 12-month price-to-earnings ratio, a measure of stock valuation, has decreased about -36% from their peak in 2020.
Chart of the Week
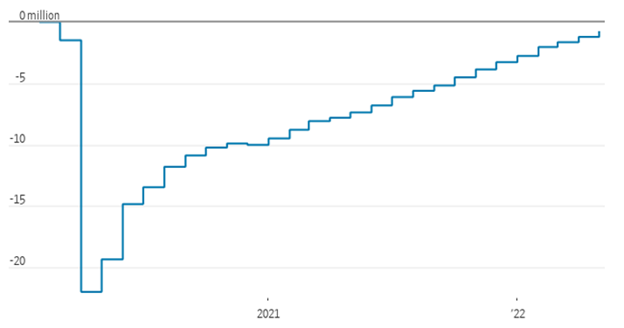
The labor market looks like it’s settled into somewhat of a stable pace of growth since 2021. As seen in the Chart of the Week below, Nonfarm Payrolls rose by 390,000 jobs over the month of May, comfortably ahead of expectations for a 318,000 rise. The rather consistent “stair-step” monthly gains in jobs since early 2021 show a slight slowdown, but is still solid, and persistent, growth. In addition to the better-than-expected May jobs growth, April’s jobs gain was revised upward to 436,000 from the initial reading of 428,000. For the first time, they are less than one million away from their pre-pandemic peak. The Labor Force Participation Rate increased to 62.3% from April’s unrevised 62.2% figure, which was in line with expectations. The Unemployment Rate remained at 3.6% for the third straight month, versus expectations for it to slip to 3.5%. Average Hourly Earnings were up +0.3% in the month, below expectations for +0.4%, but unchanged from April. Compared to last year, wages were 5.2% higher, in line with expectations, but down slightly from April’s 5.5% rise. Finally, the Average Weekly Hours worked were unchanged at April’s unrevised 34.6 hours, in line with expectations. The upside surprise in jobs growth was somewhat bittersweet in that while there was some slowdown in the pace of new jobs, it probably isn’t enough to keep the Federal Reserve from slowing its pace of tightening monetary through rate hikes and reduction of its balance sheet.
U.S nonfarm employment, change since February 2020
Note: Seasonally adjusted.
Source: Labor Department, The Wall Street Journal.
Economic Review
- The May Institute for Supply Management (ISM) Manufacturing PMI Index showed manufacturing growth (a reading above 50) unexpectedly accelerated with the index rising to 56.1 from 55.4 in April, beating expectations for a decrease to 54.5. Both new orders and production accelerated, as did inventories. However, employment declined and moved back into contraction territory. Inflation pressures also declined but remained very elevated, as prices paid came in at 82.2. The ISM Services PMI Index slowed more than expected, falling to 55.9, from the 57.1 in April, and below expectations of 56.5. A deceleration in business activity more than offset an acceleration in new orders. Meanwhile, new export orders rose, inventories declined, and prices paid decreased from the prior month’s record level.
- The similar, but separate, S&P Global U.S. Manufacturing PMI Index was unexpectedly revised lower for its final May release to 57.0 versus expectations for it to come in unrevised at 57.5. The index was below April’s reading of 59.2. A reading above 50 denotes expansion. The final May S&P Global Services PMI Index was revised slightly downward to 53.4 from the preliminary 53.5 level, where it was expected to remain and was below April’s 55.6.
- April Factory Orders were up +0.3% for the month, under forecasts for +0.7%, and the prior month’s +2.2% increase was revised lower to +1.8%. Durable Goods Orders—preliminarily reported last week—were revised higher to +0.5%, and excluding transportation, orders were upwardly-adjusted to a +0.4% gain.
- The May MNI Chicago PMI unexpectedly rose and remains firmly at expansion levels (above 50), as it climbed to 60.3 from 56.4 in April, well above expectations for a drop to 55.0. The better-than-expected result was fueled by growth in new orders as production accelerated, and employment decelerated. Inflation pressures persist as prices paid accelerated, but supplier deliveries rose at a slower pace potentially signaling relief in the supply chain challenges.
- The May Dallas Fed Manufacturing Index unexpectedly fell into contraction territory (below zero). The index sunk to -7.3 from 1.1 in April and was well below forecasts for a rise to 1.5. New orders decelerated, along with growth in employment. Inflation pressures leveled off but remain severely elevated.
- The Fed’s Beige Book, an anecdotal read on business activity across the nation that is used to prepare for the next monetary policy decision (set for June 15), showed that most Fed Districts had “slight to modest” economic growth since mid-April, while four districts noted that the pace of growth slowed. Most respondents noted that price increases rose at a “strong or robust” pace, and about half of the Districts reported the ability to pass along higher prices to consumers, but also noted some “customer pushback, such as smaller volume purchases or substitution of less expensive brands.” The greatest challenge reported was that labor markets continue to be difficult, and that supply chain disruptions persist.
- April Construction Spending rose +0.2% in the month, under expectations for a +0.5% gain and March’s upwardly revised +0.3% rise. Residential Spending grew +0.9%, more than offsetting a -0.4% decline in Non-Residential Spending.
- The May Conference Board Consumer Confidence Index fell to 106.4 from April’s upwardly revised 108.6 but was above expectations for 103.6. The Expectations Index of business conditions for the next six months decreased to 77.5 from April’s upwardly revised 79.0 level, while the Present Situation Index component fell to 149.6 from April’s upwardly revised 152.9. The labor differential—consumers’ appraisal of jobs being “plentiful” minus being “hard to get”—decreased to 39.3 from 44.7 in April.
- The S&P CoreLogic Case-Shiller Home Price Index rose +20.55% year-over-year in March, above expectations for a +20.00% rise and 20.01% the prior month. Home prices were up 2.09% month-over-month on a seasonally adjusted basis, compared to forecasts of a 1.90% gain and 2.04% the prior month.
- In other housing news, the weekly MBA Mortgage Application Index fell -2.3% last week, following the prior week’s -1.2% drop. The Refinance Index fell -5.4% and the Purchase Index slid -0.6%. The average 30-year mortgage rate declined by -13 basis points (bps) to 5.33% but remains up +216 bps from last year.
- The Labor Department’s April Job Openings and Labor Turnover Survey (JOLTS), a measure of unmet demand for labor, fell to 11.4 million jobs available to be filled from March’s upwardly revised 11.9 million. Expectations were for 11.4 million. The Hiring Rate remained at March’s 4.4% level, and Separations slipped to 4.0% from the prior month’s 4.1% pace. The Quit Rate held steady at March’s 2.9% pace.
- Weekly Initial Jobless Claims were 200,000, for the week ended May 28, below expectations for 210,000, and the prior week’s upwardly revised 211,000. Continuing Claims for the week ended May 21 dropped by 34,000 to 1,309,000, below expectations of 1,340,000.
The Week Ahead
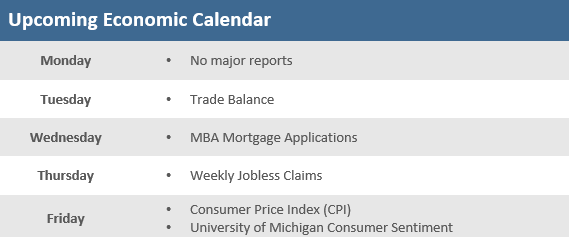
Last week was the holiday-shortened week, but it is the upcoming week of economic data that appears on break. The calendar is very light, with the only real attention-grabbing reports coming on Friday with the consumer inflation (CPI) report and the consumer sentiment reading. Unlike the past few weeks, the markets will get a reprieve from Central Bank speakers as the Fed goes dark a week ahead of its June 15 monetary policy decision.
Did You Know?
DOG DAYS OF SUMMER – The summer months of June-July-August are ranked 9th, 5th, and 11th in terms of S&P 500 performance over the last 30 years, i.e., 1992-2021. But over that 30 year span the S&P 500 returned 1,978%, or approximately 10.6% annualized average per year. Note: total returns assuming reinvestment of dividends (source: BTN Research, Bloomberg).
BUMMED – “Consumer sentiment” of the American consumer, an indicator of how optimistic consumers feel about their finances, fell in May 2022 to its lowest level since August 2011. “Consumer sentiment” has been tracked monthly since January 1978, i.e., for the last 533 months, and has been lower than the May 2022 level during just 10 months in the last 44 ½ years, i.e., 10 months out of 533 months (source: Univ. of Michigan, BTN Research).
STOCKS AND RATE HIKES – Between 6/30/2004 and 6/29/2006, the Fed raised interest rates 17 times. Each rate hike was 0.25 percentage points, a total increase of 4.25 percentage points. That took the Fed’s target short-term rate from 1.00% to 5.25%. From the close of trading on 6/30/2004 to the close of trading on 6/29/2006, the S&P 500 gained +15.7% (total return) over the 2-years, or +7.6% per year. Between 12/16/2015 and 12/19/2018, the Fed raised interest rates 9 times. Each rate hike was 0.25 percentage points, a total increase of 2.25 percentage points. That took the Fed’s target short-term rate from 0% to 2.25%. From the close of trading on 12/16/2015 to the close of trading on 12/19/2018, the S&P 500 gained +28.6% (total return) over the 3-years, or +8.7% per year (source: BTN Research).
This Week in History
WIRELESS TELECOMM – On June 3, 1880, Alexander Graham Bell transmitted the first message on his new “photophone,” which bounced sound off a mirror and used a beam of sunlight to project the mirror’s vibrations onto a photosensitive receiver. Thus began the era of wireless telecommunications (source: The Wall Street Journal).
Asset Class Performance
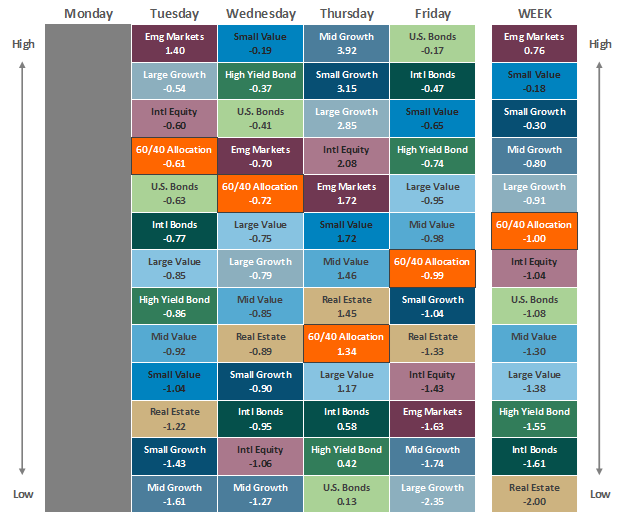
Source: Bloomberg. Asset‐class performance is presented by using market returns from an exchange‐traded fund (ETF) proxy that best represents its respective broad asset class. Returns shown are net of fund fees for and do not necessarily represent the performance of specific mutual funds and/or exchange-traded funds recommended by The Retirement Planning Group. The performance of those funds may be substantially different than the performance of the broad asset classes and to proxy ETFs represented here. U.S. Bonds (iShares Core U.S. Aggregate Bond ETF); High‐Yield Bond (iShares iBoxx $ High Yield Corporate Bond ETF); Intl Bonds (SPDR® Bloomberg Barclays International Corporate Bond ETF); Large Growth (iShares Russell 1000 Growth ETF); Large Value (iShares Russell 1000 Value ETF); Mid Growth (iShares Russell Mid-Cap Growth ETF); Mid Value (iShares Russell Mid-Cap Value ETF); Small Growth (iShares Russell 2000 Growth ETF); Small Value (iShares Russell 2000 Value ETF); Intl Equity (iShares MSCI EAFE ETF); Emg Markets (iShares MSCI Emerging Markets ETF); and Real Estate (iShares U.S. Real Estate ETF). The return displayed as “Allocation” is a weighted average of the ETF proxies shown as represented by: 30% U.S. Bonds, 5% International Bonds, 5% High Yield Bonds, 10% Large Growth, 10% Large Value, 4% Mid Growth, 4% Mid Value, 2% Small Growth, 2% Small Value, 18% International Stock, 7% Emerging Markets, 3% Real Estate.
Chris Bouffard is CIO of The Retirement Planning Group (TRPG), a Registered Investment Adviser. He has oversight of investments for the advisory services offered through TRPG.
Disclaimer: Information provided is for educational purposes only and does not constitute investment, legal or tax advice. All examples are hypothetical and for illustrative purposes only. Past performance of any market results is no assurance of future performance. The information contained herein has been obtained from sources deemed reliable but is not guaranteed. Please contact TRPG for more complete information based on your personal circumstances and to obtain personal individual investment advice.


