Quick Takes
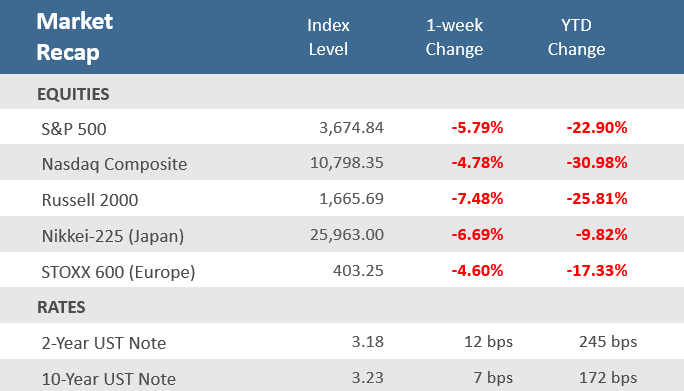
- The S&P 500 dropped -5.8% for the week, its worst week since 2020, and is now down for ten of the past eleven weeks, which has only happened once before in 1970. Meanwhile, in fixed income, Treasury bonds fell, and yields moved higher with the 10-year Treasury yield finishing up 7 basis points (bps) at 3.23%.
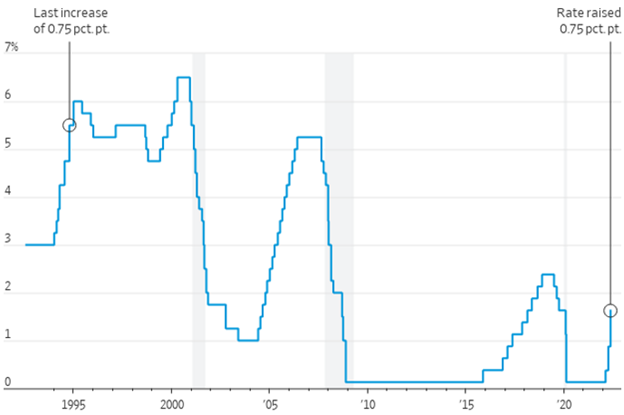
- The Federal Open Market Committee (FOMC) concluded its two-day monetary policy meeting on Wednesday with the largest interest rate increase since 1994 and signaled it would continue lifting rates this year at the most rapid pace in decades as it races to slow the economy and combat inflation that is running at a 40-year high.
- Retail sales were softer than expected for May, June manufacturing activity in the New York and Philadelphia regions unexpectedly fell into contraction, and homebuilder sentiment hit a two-year low in June, while May building permits and housing starts both fell more than expected as rapidly rising interest rates weigh on the housing market.
Fed hikes by 0.75 Percentage Point, S&P 500 in Bear Territory
The selloff that racked the market on Thursday and Friday, June 9th and 10th got even worse this past week, with the S&P 500 having its worst week since 2020 putting it at its lowest level in more than a year — and into official bear market territory. It was the tenth weekly loss in the last eleven for the S&P 500 and recession risks continue to rise following mostly weaker-than-expected economic data and a wave of monetary tightening by global central banks, including the Federal Reserve’s largest rate increase since 1994, a 0.75 percentage point hike. The central banks of England, Switzerland, Taiwan, and Brazil all hiked rates as inflation remains elevated globally. The global monetary tightening comes amid already slowing economic growth which has been exacerbated by COVID lockdowns in China and the ongoing Russia-Ukraine war. Retail sales were softer than expected for May, June manufacturing activity in the New York and Philadelphia regions unexpectedly fell into contraction, and homebuilder sentiment hit a two-year low in June, while May building permits and housing starts both fell more than expected as rapidly rising interest rates weigh on the housing market. The S&P 500 fell -5.8% for the week, with all 11 of its sectors finishing more than -15% below their recent highs. The energy sector has been the leader among sectors all year but saw heavy profit-taking over the last week sending it down -17.2%. It is still the best-performing sector this year, up +32.4% despite the heavy loss last week. The 30-stock Dow Jones Industrial Average was down -4.8% and closed under the 30,000 mark after dipping below that level on Thursday for the first time since January 2021. The tech-heavy Nasdaq Composite also slipped -4.8%. Small cap stocks were the biggest laggards, falling -7.5% for the week and sending it lower than it was pre-covid.
Treasury bonds fell and yields moved higher, with the 10-year Treasury yield finishing up 7 basis points (bps) at 3.23%. The yield curve flattened further as the 2-year Treasury yield gained 12 bps to close at 3.18%. The yield on the 2-year Treasury note traded as high as 3.44% midweek which was the highest level since 2007. The 10-year note yield flirted with 3.50%, matching its March 2011 peak. The closely watched 2-year/10-year yield curve inverted several times before rebounding toward the end of the week. The broad bond market Bloomberg Aggregate Bond Index finished down -0.9% for the week, putting it down -11.5% in 2022. Still, that was the best performance of major asset classes for the week.
Outside stocks and bonds, crude oil prices pulled back to $110.27 after hitting a multi-decade high of $120.50 last week. The U.S. dollar continued to climb, posting a fresh twenty-year high. The Financial Times reported that the strong U.S. dollar is expected to reduce the earnings of U.S. multinational companies by about $40 billion in the first half of 2022. Gold was lower despite the inflation concerns as the stronger dollar and interest rate hikes by major central banks dented its appeal (gold yields no interest). A big story during the week was a collapse in cryptocurrency prices following news that decentralized finance platform and lender Celsius had suspended customer withdrawals and transfers. That drove some panicky selling and margin calls that lasted all week. Bitcoin started the week just above $25,000.00 and was just above $20,000 as of this writing. Since hitting an all-time high of around $69,000 in November, bitcoin has tumbled about -70%.
Chart of the Week
The Federal Open Market Committee (FOMC) concluded its two-day monetary policy meeting on Wednesday with the largest interest rate increase since 1994 and signaled it would continue lifting rates this year at the most rapid pace in decades as it races to slow the economy and combat inflation that is running at a 40-year high. The FOMC raised the target for the Fed funds rate by 75 basis points (bps) to a range of 1.50% to 1.75%. Despite the sharp increase, the Committee painted an optimistic picture of the economy, noting that, “Overall economic activity appears to have picked up after edging down in the first quarter,” and “Job gains have been robust in recent months, and the unemployment rate has remained low.” However, the Committee cited supply and demand imbalances related to the pandemic, higher energy prices, the ongoing supply chain disruptions, as well as the continued war in Ukraine as putting upward pressure on inflation and weighing on global economic growth. It also said it will maintain its plans of reducing its balance sheet via its holdings of Treasury securities and agency debt and agency mortgage-backed securities. The Committee revised its GDP forecast for this year down to 1.7% from 2.8% in March, and adjusted 2023 downward by 0.5% to growth of 1.7% and 2024 to 1.9% from March’s estimate of 2.0%. It also revised its inflation outlook up for this year, to 5.2% from the previous estimate of 4.3%, and 2023 and 2024 saw slight upward revisions. In his post-announcement press conference, Chairman Jerome Powell said that the employment remains tight and that inflation is too high, with last week’s four decade high Consumer Price Index (CPI) pushing the Committee to do “more front-loading” in regards to interest rate increases. He indicated that future rate hikes of 50 bps and 75 bps are “most likely” at the upcoming meetings but reiterated that such decision will be data-dependent.
Fed Raises Rates by 0.75 Percentage Point, Largest Increase Since 1994
Federal-funds target rate
Source: Federal Reserve, The Wall Street Journal
Economic Review
- The May Producer Price Index (PPI) was up +0.8% for the month, in line with expectations, but above the downwardly revised +0.4% in April. For the full year, PPI increased +10.8%, below expectations to match April’s downwardly revised +10.9%. Core PPI, which excludes food and energy, was up +0.5% in May, below expectations for a +0.6% increase but an acceleration from the prior month’s downwardly-adjusted 0.2% increase. Year-over-year Core PPI increased +8.3%, below expectations to remain at April’s downwardly revised +8.6% rise.
- The Import Price Index rose +0.6% for the month of May, under expectations for a +1.1% increase, but above April’s upwardly revised +0.4%. Year-over-year the index was up +11.7%, below forecasts for +11.9% and April’s upwardly revised +12.5% rise.
- The May National Federation of Independent Business (NFIB) Small Business Optimism Index slipped to 93.1 from 93.2 in April, just above expectations of a decrease to 93.0. The index is at the lowest level since April 2020 and posted the fifth consecutive month below the 48-year average of 98, with small businesses expecting better business conditions over the next six months decreasing to a net negative 54%, the lowest level recorded in the survey’s history. According to the NFIB, “inflation continues to outpace compensation which has reduced real incomes across the nation.” It added that, “Small business owners remain very pessimistic about the second half of the year as supply chain disruptions, inflation, and the labor shortage are not easing.”
- The advanced estimate for May Retail Sales declined -0.3% for the month, below expectations for a +0.1% rise, and April’s downwardly revised +0.7%. Sales excluding auto dealers, which are still struggling to get cars onto their lots, rose +0.5%, which was short of expectations for +0.7% and April was revised lower to a +0.4% increase. The control group, a figure used to calculate GDP, came in flat for May, under expectations of +0.3%, and April’s downwardly revised +0.5%. The details of the report showed that some of the biggest winners in the pandemic are now experiencing setbacks. Sales at furniture and home-furnishing stores fell -0.9% from April, while sales at electronics and appliance stores fell -1.3%. Sales at nonstore retailers—a category dominated by Amazon.com—fell -1%.
- The Conference Board’s Leading Economic Index (LEI) declined -0.4% in the month of May, in line with expectations and with April’s downwardly revised decrease. It was the third negative month in a row as stock prices, consumer expectations, and building permits were the biggest detractors, more than negating gains for jobless claims and the interest rate spread. From the report: “The index is still near a historic high, but the US LEI suggests weaker economic activity is likely in the near term—and tighter monetary policy is poised to dampen economic growth even further.” Over the past five decades, the LEI has peaked a minimum of 7 months, and an average of 11 months before the next recession.
- The Federal Reserve reported Industrial Production increased +0.2% in May, below expectations of +0.4%, and well below April’s upwardly revised +1.4%. Manufacturing output declined after three months when growth averaged nearly +1.0%, while mining and utilities output both rose solidly. Year-over-year (YoY), Industrial Production was at a new all-time high in May at +6% and the Manufacturing component was +5% YoY. Capacity Utilization inched up to 79.0% from the prior month’s downwardly revised 78.9%, just below expectations for an increase to 79.2%.
- The June Empire Manufacturing Index, a measure of factory activity in the New York region, improved but remained in contraction (a reading below zero) rising to -1.2 from -11.6 in May and compared to estimates of +2.3. New orders moved back into expansion territory, along with shipments, but unfilled orders fell into contraction territory. Prices paid slowed but remained historically high, and employment growth accelerated.
- The June Philly Fed Manufacturing Business Outlook Index unexpectedly fell into contraction (a reading below zero) for the first time in two years, sinking to -3.3, far below expectations for 5.0 and down from 2.6 in May. New orders plunged into negative territory, shipments slowed materially, and inventories contracted, but employment growth accelerated. Prices paid decelerated but remain high.
- Homebuilder sentiment fell to a two-year low in June as the National Association of Home Builders (NAHB) Housing Market Index (HMI) fell to 67 from 69 in May, in line with estimates. The NAHB said, “Six consecutive monthly declines for the HMI is a clear sign of a slowing housing market in a high inflation, slow growth economic environment.”
- May Housing Starts fell -14.4% in the month to an annual pace of 1,549,000 units, below expectations for a 1,693,000 unit pace, and well under April’s upwardly revised 1,810,000 units. Building Permits fell -7.0% to an annual rate of 1,695,000, below expectations for 1,778,000 units, and April’s upwardly revised 1,823,000 units.
- Weekly MBA Mortgage Application Index rose +6.6%, erasing last week’s drop of -6.5% and breaking four consecutive week of declines. The Refinance Index was up +3.7% from last week and the Purchase Index popped +8.1% for the week. The gains came in spite of the average 30-year mortgage rate continuing its ascent, which was up +25 basis point (bps) to 5.65% and is up +254 bps from last year.
- Weekly Initial Jobless Claims were 229,000, for the week ended June 11, above expectations for 217,000, but below the prior week’s upwardly revised 232,000. Continuing Claims for the week ended June 4 were up 3,000 to 1,312,000, above expectations of 1,304,000.
The Week Ahead
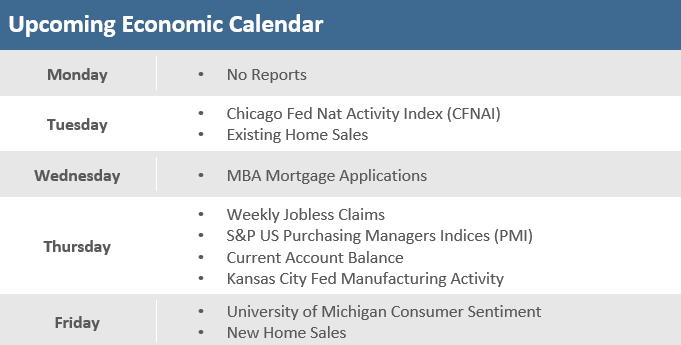
In a shortened week due to Monday’s Juneteenth observation, the economic calendar will be lighter, but the docket still has some data points of note with existing and new home sales, which have seen slowing activity amid the drop in housing affordability due to surging prices and spiking mortgage rates. The Chicago Fed National Activity Index and the June preliminary Manufacturing and Services PMIs from S&P Global will be watched closely for signals of economy growth. The revision to the June University of Michigan Consumer Sentiment Index comes late in the week, its preliminarily reading tumbled to a record low last week on inflation concerns. Federal Reserve members will be speaking again after last week’s FOMC hike, headlined by the two-day semi-annual Congressional testimony from Chairman Jerome Powell.
Did You Know?
FIRST TOILET PAPER. THEN BABY FORMULA. NOW HOT SAUCE. – The maker of one of the U.S.’s most beloved condiments—Huy Fong Foods—has been forced to suspend production of its iconic spicy sauces due to a shortage of chili peppers. The company confirmed Wednesday that a shortage of peppers in its inventory had affected production of Sriracha Hot Chili Sauce, Chili Garlic and Sambal Oele (source: Bloomberg).
SPENDING MORE, SAVING LESS – The nation’s personal savings rate, which soared during the early months of the pandemic, has now fallen back to below its pre-pandemic levels. The savings rate was 7.8% in January 2020, rose to 33.8% in April 2020, and now has dropped back to 4.4% in April 2022. The 4.4% rate is the lowest recorded in the United States since September 2008 (source: Bureau of Economic Analysis, BTN Research).
FUNDING A RETIREMENT – The S&P 500 has averaged +9.8% per year (total return) over the 25 years ending 12/31/2021. A lump-sum of $865,656 (in a pre-tax account) will sustain a 20-year payout of $100,000 per year (i.e., $2 million of gross distributions before taxes) assuming the funds continue to earn +9.8% annually. This mathematical calculation ignores the ultimate impact of taxes on the account which are due upon withdrawal, is for illustrative purposes only, and is not intended to reflect any specific investment or performance. Actual results will fluctuate with market conditions and will vary (source: BTN Research).
This Week in History
LARGEST SECURITIES FRAUD BUST IN US HISTORY – On June 14, 2000, members of all five New York City Mafia crime families were indicted for allegedly participating in a securities fraud scheme. The FBI and SEC conducted the largest securities fraud bust in history, indicting 120 people, including Mafia members, securities dealers and even the treasurer of New York City’s police detectives pension fund on charges ranging from racketeering to securities fraud to solicitation to commit murder. The accusations stemmed from an investigation codenamed Operation Uptick, in which authorities said participants manipulated the trading activity of 19 microcap stocks and defrauded investors out of $50 million. The list of 120 indictments for the vast pump-and-dump scheme included 11 alleged members of Mafia families, 57 licensed and unlicensed stockbrokers, 12 stock promoters, 30 officers or company insiders, two accountants, an attorney, an investment advisor and a hedge fund manager (source: Bezinga).
Asset Class Performance
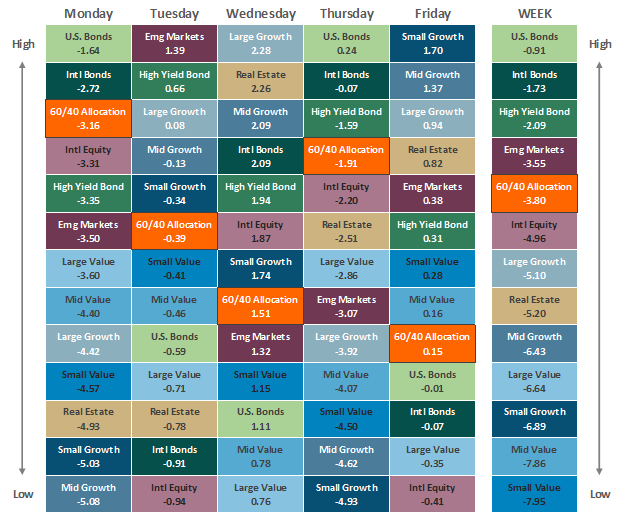
Source: Bloomberg. Asset‐class performance is presented by using market returns from an exchange‐traded fund (ETF) proxy that best represents its respective broad asset class. Returns shown are net of fund fees for and do not necessarily represent the performance of specific mutual funds and/or exchange-traded funds recommended by The Retirement Planning Group. The performance of those funds may be substantially different than the performance of the broad asset classes and to proxy ETFs represented here. U.S. Bonds (iShares Core U.S. Aggregate Bond ETF); High‐Yield Bond (iShares iBoxx $ High Yield Corporate Bond ETF); Intl Bonds (SPDR® Bloomberg Barclays International Corporate Bond ETF); Large Growth (iShares Russell 1000 Growth ETF); Large Value (iShares Russell 1000 Value ETF); Mid Growth (iShares Russell Mid-Cap Growth ETF); Mid Value (iShares Russell Mid-Cap Value ETF); Small Growth (iShares Russell 2000 Growth ETF); Small Value (iShares Russell 2000 Value ETF); Intl Equity (iShares MSCI EAFE ETF); Emg Markets (iShares MSCI Emerging Markets ETF); and Real Estate (iShares U.S. Real Estate ETF). The return displayed as “Allocation” is a weighted average of the ETF proxies shown as represented by: 30% U.S. Bonds, 5% International Bonds, 5% High Yield Bonds, 10% Large Growth, 10% Large Value, 4% Mid Growth, 4% Mid Value, 2% Small Growth, 2% Small Value, 18% International Stock, 7% Emerging Markets, 3% Real Estate.
Chris Bouffard is CIO of The Retirement Planning Group (TRPG), a Registered Investment Adviser. He has oversight of investments for the advisory services offered through TRPG.
Disclaimer: Information provided is for educational purposes only and does not constitute investment, legal or tax advice. All examples are hypothetical and for illustrative purposes only. Past performance of any market results is no assurance of future performance. The information contained herein has been obtained from sources deemed reliable but is not guaranteed. Please contact TRPG for more complete information based on your personal circumstances and to obtain personal individual investment advice.


