Quick Takes
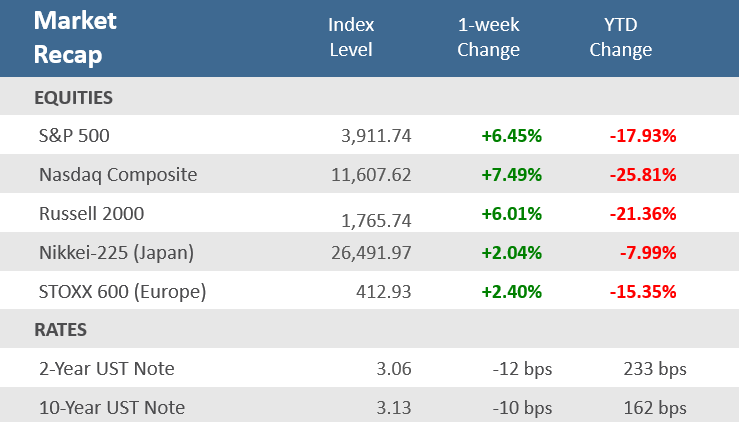
- Stocks rebounded sharply last week as the S&P 500’s +6.5% gain erased the prior week’s -5.8% drop, thanks to a big +3.01% rally on Friday, the strongest daily gain since May 18, 2020. As a result, the S&P 500 exited bear market territory, and all the major U.S. stock indexes snapped three-week losing streaks.
- Bond yields declined after Powell’s Congressional testimony during the week in which he stated that the central bank’s inflation fight is “unconditional” but acknowledged that a recession is possible. The 10-year U.S. Treasury yield closed at 3.13%, down 10 basis points for the week, and trended lower since the prior week’s surge to 2011 highs of 3.5%.
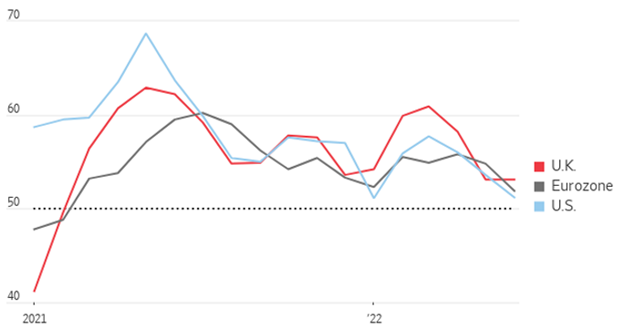
- Economic growth in the U.S. and Europe slowed sharply in June as higher prices for energy and food chilled consumer demand for other goods and services. They remain at expansion levels (readings above 50), but the U.S. Composite PMI fell to 51.2 from 53.6 in May, a 5-month low, while the eurozone PMI fell to 51.9 in June from 54.8 in May, a 16-month low.
Stocks Have First Positive Week of June; Bonds Gain as Well
The S&P 500 rallied 3.06% on Friday to wrap up a big comeback week for the stock market that followed the worst weekly decline since the start of the pandemic. Speaking of the pandemic, the Friday rally was the best day for the S&P 500 since May 18, 2020, and helped send the index to the second best week for the S&P 500 since November 2020 (following the rally last month, the week ending May 27). All major U.S. indexes snapped three-week losing streaks — with the Dow Jones Industrial Average gaining +5.4%, the S&P rising +6.5%, the Russell 2000 small cap index up +6.0%, and the tech-heavy Nasdaq Composite surging +7.5%. As a result of the big week, the S&P 500 exited bear market territory (a -20% decline from the previous peak) after joining the NASDAQ and Russell 2000 there on June 16th. Stocks showed some resiliency in the face of high inflation forcing the Fed to get more aggressive with its monetary policy as Chairman Jerome Powell reiterated last week on Capitol Hill that the Central Bank will need to remain aggressive to restore price stability. His comments came after the Fed raised the target for the fed funds rate by 75 basis points (bps) the prior week and suggested more hikes of that magnitude could come. But investors were encouraged on Friday by economic data that included better than expected new home sales for May and some improvement in inflation expectations from the latest University of Michigan survey of consumer sentiment––which was interpreted positively as reducing the pressure on the Federal Reserve to hike rates more steeply. Recession chatter had picked palpably recently, contributing to the market volatility, but the strong week for stocks now has many asking the question of whether the markets have found a bottom. Historically, a year after the S&P 500 crossed into a bear market, it rebounded by about 20% on average.
Bond yields declined after Powell’s Congressional testimony that the central bank’s inflation fight is “unconditional” but acknowledged that a recession is possible. The benchmark 10-year U.S. Treasury yield, which closed the week down 10 basis points at 3.13%, has been trending lower since the prior week’s surge to 2011 highs near 3.5% after the Federal Reserve’s biggest interest rate increase since 1994. Bond yields fall when prices rise. Data from interest-rate derivatives markets suggests that traders think the Fed could be cutting rates again by the second half of next year. When the Fed began raising interest rates again this year, it said it was hoping to pull off a soft landing, a scenario in which it slows the economy enough to rein in inflation but not so much that it triggers a recession. The seesaw between inflation fears and recession fears are likely to shape market headlines until second quarter earnings season gets underway in a couple of weeks.
Chart of the Week
Economic growth in the U.S. and Europe slowed sharply in June as higher prices for energy and food chilled consumer demand for other goods and services. The preliminary June S&P Global U.S. Manufacturing PMI Index fell to 52.4, well below May’s unrevised 57.0 and expectations for 56.0. The preliminary S&P Global U.S. Services PMI Index also slowed more than expected, slipping to 51.6, under expectations of 53.3 from down from 53.4 in May. They remain at expansion levels, but the U.S. Composite PMI—which measures activity in both the manufacturing and services sectors—fell to 51.2 in June from 53.6 the previous month to reach a five-month low. Readings above 50.0 indicate economic expansion, while readings below 50.0 point to economic contraction. European economies also slowed sharply but remain above expansion levels. The eurozone PMI fell to 51.9 in June from 54.8 in May, a 16-month low.
Sharp Slowdown in Economic Activity
Composite Purchasing Managers Index (PMIs)
Source: S&P Global, The Wall Street Journal
Economic Review
- The Chicago Fed National Activity Index (CFNAI) fell to 0.01 in May, far below expectations of 0.47 and 0.40 in April. Production-related indicators contributed –0.01, Employment-related indicators contributed +0.08. Personal consumption and housing were below trend. The three-month moving average index was also down in May at 0.20 after 0.40 in April, down the second month in a row and signals that growth is fading to a softer pace of expansion.
- The June Kansas City Fed Manufacturing Activity Index slowed by a smaller amount than expected and remained in expansion territory (a reading above zero). The index decreased to 12 from May’s unrevised 23 reading and compared to forecasts calling for a decline to 10.
- The June final University of Michigan Consumer Sentiment Index was unexpectedly revised down to a record low of 50.0, from the preliminary 50.2 figure, where it was expected to remain. The Current Conditions component of the survey was adjusted down, while the Expectations component was revised higher but remained depressed. The overall index was below 58.4 in May and the all-time low came as both Current Conditions and Expectations components were down sharply from the prior month. The 1-year inflation forecast was revised lower to 5.3% from the initial report of 5.4%, where it was expected to remain, which was the level in May. The 5-10 year inflation forecast was revised lower to 3.1%, from the preliminary read of 3.3%, where it was expected to remain, but above 3.0% in May.
- May New Home Sales jumped +10.7% to an annual rate of 696,000 units, far above expectations of 590,000 units, and April’s upwardly revised 629,000 units. The median new home price rose +15.0% from the prior year to $449,000. New home inventory declined to 7.7 months of supply from April’s level of 8.3 months at the current sales pace. Sales were for the month in the South and the West but fell in the Midwest and the Northeast. Sales in the South and West were modestly higher for the year, while sales in the Northeast and the Midwest were sharply lower.
- May Existing Home Sales fell -3.4% for the month to an annual rate of 5.41 million units, just under expectations for 5.40 million, and below April’s downwardly revised 5.60 million. Contract closings fell for the fourth straight month as sales in all four major U.S. regions declined over the month. Year-over-year, sales were lower in all regions. The median existing home price was up +14.8% from a year ago to a record high $407,600 and are up for 123 straight months as prices grew all regions. Unsold inventory was at a 2.6-months pace at the current sales rate, up from the from the 2.5-months pace a year earlier.
- Weekly MBA Mortgage Application Index rose +4.2%, following the prior week’s increase of 6.6%. The Refinance Index dropped -3.1% from last week and the Purchase Index popped +7.9% for the week. The gains came despite the average 30-year mortgage rate jumping ascent, which was up +25 basis point (bps) to 5.65% and is up +254 bps from last year.
- Weekly Initial Jobless Claims were 229,000, for the week ended June 18, above expectations for 226,000, but below the prior week’s upwardly revised 231,000. Continuing Claims for the week ended June 11 were up 5,000 to 1,315,000, above expectations of 1,320,000.
The Week Ahead
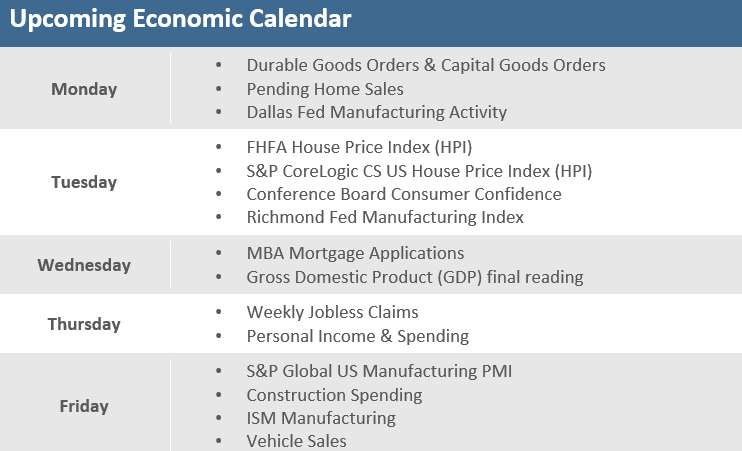
A tough second quarter for the market will come to an end this week with a fairly busy economic calendar. Reports include preliminary Durable Goods Orders on Monday, Consumer Confidence and Home Prices on Tuesday, GDP on Wednesday, and Manufacturing PMIs and Construction Spending on Friday. Near the end of the week, oil traders will be watching the OPEC+ meeting to see if they will proceed with the targeted August oil production increase against a backdrop of high prices and limited spare capacity for some members. The week precedes the three-day Independence Day holiday and portfolio managers are expected to be rebalancing ahead of Q3, potentially buying more stocks to keep asset allocations at their intended levels after the quarter’s losses. For Fed watchers, New York Fed President John Williams speaks Monday, San Francisco President Mary Daly speaks Tuesday, and on Wednesday Chairman Jerome Powell will participate in a European Central Bank summit, and notorious hawk St. Louis Fed President James Bullard also has an event.
Did You Know?
DOGGONE IT – More than 23 million American households–or nearly 1 in 5–have adopted a pet since the pandemic began, according to the ASPCA. During much of the past two years, these pets have had the attention of their owners 24/7 as lockdowns and work-from-home was the norm. But as people returned to work, their pets–in particular, their dogs–aren’t coping all that well. According to The Wall Street Journal, owners returning home to destroyed furniture and chewed-up shoes are resorting to anti-anxiety medication, spa treatments, and special treats to calm their dogs. Prescriptions for anxiety medications through PetMeds, an online pet pharmacy, jumped +26% between 2019 and 2021 (source: Hedgeye, The Wall Street Journal, ASPCA).
GOING DIGITAL – The weekday daily circulation of US newspapers has fallen -57% over the 2 decades between 2000 (55.8million) and 2020 (24.2 million) (source: Census Bureau, BTN Research).
STILL EXPENSIVE – The price of lumber more than quadrupled during the pandemic before falling -65% from a 5/02/2021 high but is still +45% higher today than where the price was at the end of 2019. Lumber was trading at $403.60/thousand board feet (MBF) on 12/29/2019, rose to $1,686/MBF on 5/02/2021, but has since fallen back to $585.70/MBF as of Friday 6/17/2022. One board foot is equal to a piece of lumber that is 1 foot in length, 1 foot in width but just 1 inch in thickness (source: Chicago Mercantile Exchange, BTN Research).
This Week in History
TEENIE TIME – On June 24, 1997, the New York Stock Exchange began quoting share prices in 1/16ths, nicknamed “steenths” or “teenies.” In theory, this narrowed the spread between the bid price and the ask price, increasing the net return for investors. But in practice, the move to “teenies” made filling large orders at a good price much harder, raising the cost of many trades (source: The Wall Street Journal).
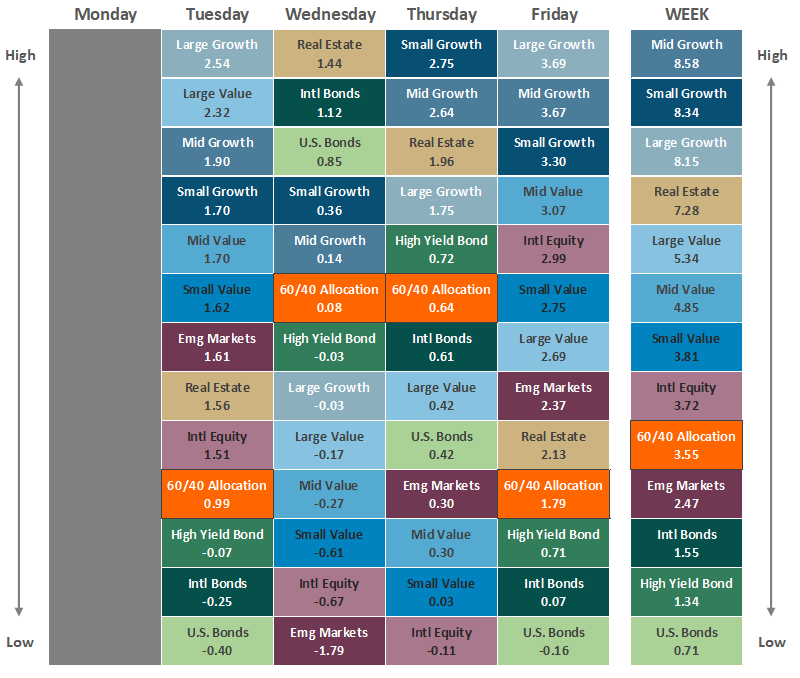
Asset Class Performance
Source: Bloomberg. Asset‐class performance is presented by using market returns from an exchange‐traded fund (ETF) proxy that best represents its respective broad asset class. Returns shown are net of fund fees for and do not necessarily represent the performance of specific mutual funds and/or exchange-traded funds recommended by The Retirement Planning Group. The performance of those funds may be substantially different than the performance of the broad asset classes and to proxy ETFs represented here. U.S. Bonds (iShares Core U.S. Aggregate Bond ETF); High‐Yield Bond (iShares iBoxx $ High Yield Corporate Bond ETF); Intl Bonds (SPDR® Bloomberg Barclays International Corporate Bond ETF); Large Growth (iShares Russell 1000 Growth ETF); Large Value (iShares Russell 1000 Value ETF); Mid Growth (iShares Russell Mid-Cap Growth ETF); Mid Value (iShares Russell Mid-Cap Value ETF); Small Growth (iShares Russell 2000 Growth ETF); Small Value (iShares Russell 2000 Value ETF); Intl Equity (iShares MSCI EAFE ETF); Emg Markets (iShares MSCI Emerging Markets ETF); and Real Estate (iShares U.S. Real Estate ETF). The return displayed as “Allocation” is a weighted average of the ETF proxies shown as represented by: 30% U.S. Bonds, 5% International Bonds, 5% High Yield Bonds, 10% Large Growth, 10% Large Value, 4% Mid Growth, 4% Mid Value, 2% Small Growth, 2% Small Value, 18% International Stock, 7% Emerging Markets, 3% Real Estate.
Chris Bouffard is CIO of The Retirement Planning Group (TRPG), a Registered Investment Adviser. He has oversight of investments for the advisory services offered through TRPG.
Disclaimer: Information provided is for educational purposes only and does not constitute investment, legal or tax advice. All examples are hypothetical and for illustrative purposes only. Past performance of any market results is no assurance of future performance. The information contained herein has been obtained from sources deemed reliable but is not guaranteed. Please contact TRPG for more complete information based on your personal circumstances and to obtain personal individual investment advice.


