Quick Takes
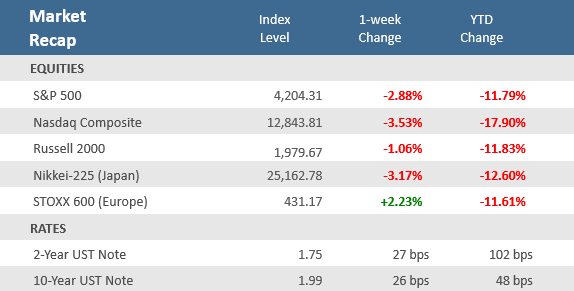
- The Russia-Ukraine fighting has continued to intensify, and inflation has accelerated further, which left all major U.S. indexes in the red for yet another week. For the week, the Dow, S&P 500, and Nasdaq fell 2%, 2.9%, and 3.5%, respectively, and the yield on the 10-year Treasury climbed to just under 2%.
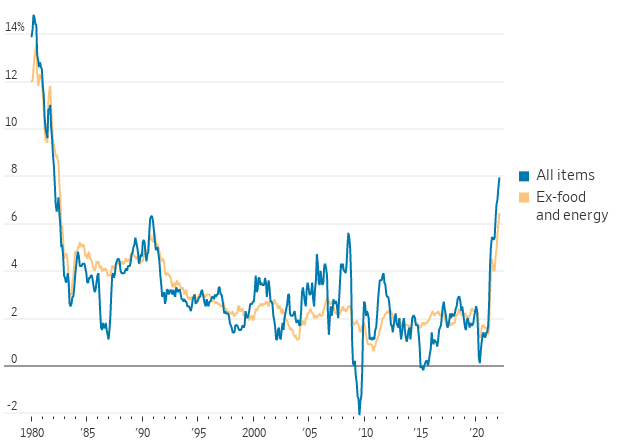
- Consumer inflation hit its highest annual rate in February since January 1982 as the headline Consumer Price Index (CPI) came in at +7.9%. Core CPI, which strips out the more volatile food and energy segments, was up +6.4%, matching expectations.
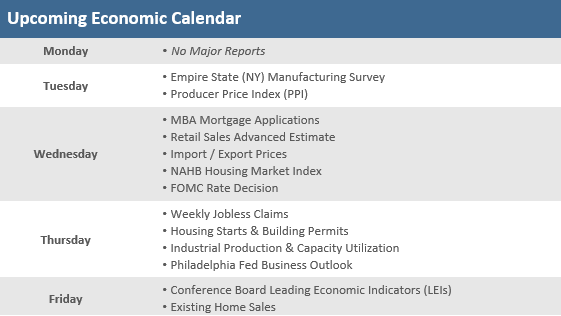
- The Russia-Ukraine conflict will continue to dominate headlines. Still, investors will be watching the US Federal Reserve, which is set to raise interest rates by 25 basis points on Wednesday. Retail sales and industrial production are also on the calendar this week.
Stocks drop further as Russia-Ukraine war drags on
The Russian invasion of Ukraine continues to intensify as the war enters its third week. Diplomats failed to make any breakthroughs with peace talks, and President Biden called for an end to Russia’s status as a preferred trade partner. Meanwhile, Congress passed a $1.5 trillion funding bill Thursday night to keep the government running through September and includes $14 billion. The uncertainty surrounding the Russia-Ukraine conflict and the resulting headlines from the intensified fighting keeps volatility elevated. For example, look at a few of the wild swings and corresponding headlines during the week:
Monday: S&P 500 SINKS 2.9% FOR WORST CLOSE SINCE OCTOBER 2020
Wednesday: S&P 500 CLOSES 2.6% HIGHER FOR BIGGEST GAIN SINCE JUNE 2020
Friday: S&P LOSES 2.9%, NASDAQ DROPS 3.5% FOR WORST WEEK SINCE JAN. 21
The prominent market swings show how much investors are struggling to understand the economic and corporate earnings implications of the Russia-Ukraine conflict. Beyond the geopolitical situation, inflation concerns were amplified with this week’s Consumer Price Index (CPI) showing inflation accelerated to a new 40-year high–and that doesn’t yet reflect the recent spike in oil and commodity prices from the Russia-Ukraine conflict that pushed the Refinitiv/CRB Commodities Index to the largest weekly gain in its 65-year history last week. The bond market was volatile as well, with U.S. Treasury prices falling sharply from last week’s rally as the yield on the 10-year Treasury fell to 1.69% early in the week but then rose 30 basis points (+0.3 percentage points) to close the week at 1.99%. The Federal Reserve is expected to raise rates by 25 basis points on Wednesday this week, the first Fed rate hike since December 2018. Markets are pricing in about six quarter-point hikes before the end of the year. With no indication for an impending cease-fire in fighting on the Russia-Ukraine front, and with a very busy economic calendar, the choppy markets are likely to persist in the coming week.
Chart of the Week
February brought another four-decade high to U.S. inflation as the Consumer Price Index (CPI) rose +0.8% for the month and +7.9% year-over-year. Headline CPI hasn’t been that high since it was 8.4% in January 1982. Core CPI, which strips out the more volatile food and energy segments, increased +0.5% in February, matching forecasts, and slightly below January’s unadjusted +0.6% rise. Year-over-year Core CPI was up +6.4%, matching expectations, and ahead of January’s unrevised 6.0% rise. Higher energy prices, including gasoline, helped push up the inflation reading, along with cost gains for groceries, restaurant food, transportation services, and apparel. These numbers do not yet reflect the full inflationary impact of the Russia-Ukraine war. Regular gasoline averaged $3.52 a gallon last month, according to the Energy Information Administration, but is now above $4.10.
Price Pressure
U.S. consumer price index (CPI), 12-month change (%)
Source: Labor Department, The Wall Street Journal. Note: Seasonally adjusted
Economic Review
- The National Federation of Independent Business (NFIB) Small Business Optimism Index for February slipped to 95.7 from 97.1 in January, well below expectations for a rise to 97.3. The report noted that inflation is the single most important problem plaguing small businesses right now. The NFIB said, “Inflation continues to be a problem on Main Street, leading more owners to raise selling prices again in February. Supply chain disruptions and labor shortages also remain problems, leading to lower earnings and sales for many.”
- The January Trade Balance showed the deficit widened more than expected, rising to $89.7 billion, from December’s upwardly-revised deficit of $82.0 billion, well above forecasts of an increase to $87.3 billion. Exports declined -1.7% month-over-month and imports rose +1.2%.
- The Job Openings and Labor Turnover Survey (JOLTS), a measure of unmet demand for labor, showed a decrease to 11.26 million jobs available to be filled in January, from December’s upwardly-revised record-high 11.45 million rate, beating expectations for 10.95 million. The report showed the hiring rate remained at December’s 4.3% level, and separations dipped to 4.0% from the prior month’s 4.1% pace. The quit rate fell to 2.8% from 3.0% in December.
- The March preliminary University of Michigan Consumer Sentiment Index fell more than expected to 59.7, versus expectations for a dip to 61.0 from 62.8 in February. The index hit the lowest level since September 2011 as both the current conditions and expectations components fell. The 1-year inflation forecast rose to 5.4%—the highest since 1981—from 4.9%.
- Weekly unemployment claims rose unexpectedly to 227,000 versus estimates of 217,000 and the prior week’s upwardly revised 216,000. Continuing claims, a proxy for the total number of people on unemployment rolls through regular state programs, were slightly higher by 25,000 to 1,494,000, above estimates of 1,450,000.
The Week Ahead
Investors will continue to watch the Russia-Ukraine conflict, but there is also a busy economic calendar this week. Despite the recent market declines the US Federal Reserve is set to raise interest rates this week. Consensus estimates are firmly settled on a 25 basis point move. Other upcoming economic releases include producer inflation, retail sales, and industrial production. Industrial production will be interesting given the surge in oil and gas prices.
Did You Know?
DEFAULT – Russia announced on 8/17/1998 that it was unable to service its government debt (both short-term and long-term) with a face value of $45 billion, causing ripples in the global economy. The S&P 500 fell 11.6% (total return) within 2 weeks (to 8/31/1998) before recovering. From 8/17/1998 to 2/17/1999 (6 months), the S&P 500 was up +13.8% (total return), continuing a bull run that would end on 3/24/2000 (source: BTN Research).
TAKE THIS JOB AND… – 47.4 million Americans quit their full-time jobs in 2021, the highest annual number recorded in the United States based on data tracked since 2001 (source: Department of Labor, BTN Research).
PLEASE? – 49% of 639 small business owners surveyed in December 2021 report they have job openings that they are unable to fill (source: National Federation of Independent Business).
This Week in History
GFC Low – On March 9, 2009, the Dow Jones Industrial Average and the S&P 500 closed at their lowest levels of the Great Financial Crisis. The S&P 500 closed at 676.53 and the Dow closed at 6,547.05. Concerns about the soundness of major U.S. banks and the integrity of the U.S. financial system triggered heavy selling pressure throughout late 2008 and early 2009. Neither the Bush Administration’s $700 billion Troubled Asset Relief Plan in October 2008 nor the Obama Administration’s $787 billion stimulus package in February 2009 could stop the sell off. The Federal Reserve took the unprecedented (at the time) measure of cutting interest rates to 0% for the first time in history. The S&P 500 closed the week at 4,204.31, representing a 705.9% total return (with dividends reinvested), or 14.4% annualized since the March 9, 2009 low (source: Benzinga, Bloomberg).
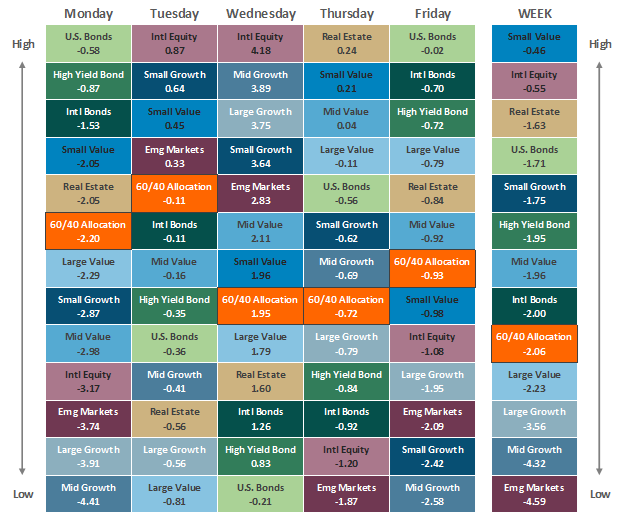
Asset Class Performance
The Importance of Diversification. Diversification mitigates the risk of relying on any single investment and offers a host of long-term benefits, such as lowering portfolio volatility, improving risk-adjusted returns, and helping investments to compound more effectively.
Source: Bloomberg. Asset‐class performance is presented by using market returns from an exchange‐traded fund (ETF) proxy that best represents its respective broad asset class. Returns shown are net of fund fees for and do not necessarily represent the performance of specific mutual funds and/or exchange-traded funds recommended by The Retirement Planning Group. The performance of those funds may be substantially different than the performance of the broad asset classes and to proxy ETFs represented here. U.S. Bonds (iShares Core U.S. Aggregate Bond ETF); High‐Yield Bond (iShares iBoxx $ High Yield Corporate Bond ETF); Intl Bonds (SPDR® Bloomberg Barclays International Corporate Bond ETF); Large Growth (iShares Russell 1000 Growth ETF); Large Value (iShares Russell 1000 Value ETF); Mid Growth (iShares Russell Mid-Cap Growth ETF); Mid Value (iShares Russell Mid-Cap Value ETF); Small Growth (iShares Russell 2000 Growth ETF); Small Value (iShares Russell 2000 Value ETF); Intl Equity (iShares MSCI EAFE ETF); Emg Markets (iShares MSCI Emerging Markets ETF); and Real Estate (iShares U.S. Real Estate ETF). The return displayed as “Allocation” is a weighted average of the ETF proxies shown as represented by: 30% U.S. Bonds, 5% International Bonds, 5% High Yield Bonds, 10% Large Growth, 10% Large Value, 4% Mid Growth, 4% Mid Value, 2% Small Growth, 2% Small Value, 18% International Stock, 7% Emerging Markets, 3% Real Estate.
Chris Bouffard is CIO of The Retirement Planning Group (TRPG), a Registered Investment Adviser. He has oversight of investments for the advisory services offered through TRPG.
Disclaimer: Information provided is for educational purposes only and does not constitute investment, legal or tax advice. All examples are hypothetical and for illustrative purposes only. Past performance of any market results is no assurance of future performance. The information contained herein has been obtained from sources deemed reliable but is not guaranteed. Please contact TRPG for more complete information based on your personal circumstances and to obtain personal individual investment advice.

