Quick Takes
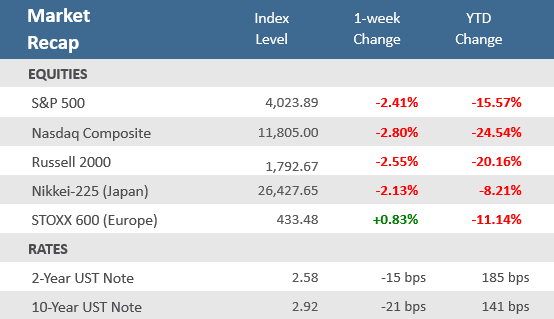
- The volatility that has come to characterize capital markets in 2022, continued unabated in the latest week of trading. The S&P 500 and Dow were on course to join the Nasdaq and Russell 2000 indices in bear market territory (a decline of -20% or worse), until a furious Friday rally mitigated their losses. Still major equity indices are sitting on multiple week loss streaks that are the longest in years.
- The yield on the benchmark 10-year Treasury note rose to 3.2% during the week, the highest level since November 2018, but had settled back to 2.92% by the end of the week. Growth concerns and a general flight to safety helped push demand for Treasuries, which drove yields lower in a curve-flattening manner this week with 2-year yields increasing nearly as much as 10-year yields.
- Consumer and producer inflation came in hotter than expected from year-ago levels and remain near multi-decade highs. CPI was 8.3% higher than last April, its second straight reading above 8%. PPI came in 11% higher than last April, its second straight month above 11%. According to FactSet, inflation was cited as a factor in about 85% of S&P 500 company earnings reports for the first quarter, the most going back to at least 2010.
Stocks end week with rally but still notch six-week losing streak
Stocks and other risk assets rallied big on Friday, but it wasn’t enough to avoid another week of losses for most major global equity indices. The S&P 500 and Nasdaq have now posted six straight weeks of declines, while the Dow Jones Industrial Average is at its seventh-consecutive weekly loss. Even with Friday’s gains, the S&P 500 fell -2.4% to hit its longest weekly losing streak since 2011, while the Nasdaq slipped -2.8%. The markets continue grapple with the same headwinds of aggressive Federal Reserve policy tightening, persistent inflation, rising interest rates, as well as the geopolitical challenges from the Russia-Ukraine war. The widespread COVID-related lockdowns in China are also adding to the hurdles for the global economy. The Consumer Discretionary and Information Technology sectors continue to be the largest detractors from performance and are weighing more on the Nasdaq and growth-oriented indices which those sectors are weighted the heaviest in. Though Friday’s rally couldn’t keep the S&P 500 and Dow from another weekly loss, it was enough to keep them from sinking into bear market territory, typically defined as a -20% or worse decline from their all-time highs. The S&P 500′s dip to 3,858.87 on Thursday took the index to a decline of 19.55% from its January 4 all-time high on an intraday basis — very close to the official -20% decline for a bear market.
The rapid rise in bond yields also took a pause, after the 10-year U.S. Treasury yield peaked this past week at 3.2%, it settled back to 2.92% at Friday’s close. Yields move inversely to prices and 1 basis point is equal to 0.01%. On Monday the yield on the 10-year U.S. Treasury hit 3.20%, its highest level since November 2018. That came a week after the 10-year yield broke above 3% for the first time since 2018. Bank of America lowered its year-end targets for the 2-year and 10-year notes to 3.5% and 3.25%, respectively, noting that it expects yields to fall in 2023 as signs of an economic slowdown persist and investors seek traditional safe havens among elevated volatility.
The Q1 earnings season is nearly over with 457 of the S&P 500 companies having now reported. According to FactSet, the percentage of S&P 500 companies beating earnings per share (EPS) estimates is above the five-year average, but the magnitude of these positive surprises is below the five-year average. Overall, 79% have reported actual EPS above estimates, which is above the five-year average of 77%. In aggregate, companies are reporting earnings that are 4.9% above estimates, which is below the five-year average of 8.9%. The blended (combines actual results for companies that have reported and estimated results for companies that have yet to report) earnings growth rate for the first quarter is +9.1% today, compared to an earnings growth rate of +7.0% last week and an earnings growth rate of +4.6% at the end of the first quarter (March 31).
Chart of the Week
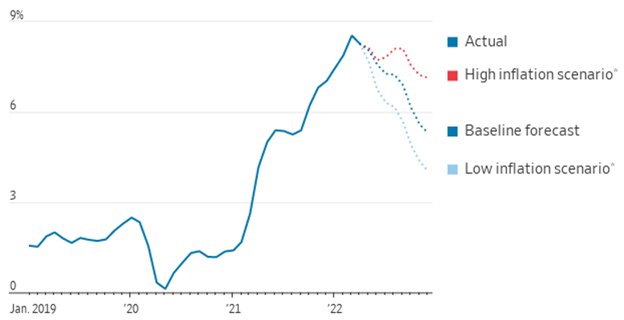
Consumer inflation came in hotter than expected in April, with the Consumer Price Index (CPI) registering an annual rate of 8.3% vs estimates of 8.1%. That would have been the highest level in 40 years—if it weren’t for March, which was 0.2% higher. Still, that’s two straight months now that inflation clocked in above 8%. The good news is that sometime in the next 12 months, it will very likely fall to around half that. Bottom-up analysis of the CPI’s components, inflation-linked bond yields, and wage behavior all point toward inflation settling at roughly 4%. The more important question is what comes after that? The hope is that it regresses back down to the Fed’s 2% target. But there are good reasons to think it may be stickier than that. The April CPI release showed that food and shelter costs accelerated, and with shelter making up about a third of CPI—and rising at its fastest pace since 1991—it is hard to see it rolling back to that 2% target any time soon.
Inflation Is Headed Lower—but By How Much?
12-month change in consumer-price index
Source: Omair Sharif, Inflation Analytics; The Wall Street Journal.
Economic Review
- The Consumer Price Index (CPI) rose +0.3% for the month of April, higher than expectations for a +0.2% gain, but down from March’s unrevised +1.2% increase. Core CPI, which excludes out food and energy, increased +0.6% in April, also higher than expectations (+0.4%) and above March’s unrevised +0.3% increase. Compared to last year, CPI was +8.3% higher, beating expectation of +8.1%, but down slightly from March’s +8.5% annual rate, which was a 40-year high. Core CPI was up +6.2% year-over-year, higher than expectations of +6.0%, and down from March’s unrevised +6.5% annual rate. The Bureau of Labor Statistics (BLS) said increases for shelter, food, airline fares, and new vehicles were the largest contributors to the hotter-than-expected report. Grocery prices were up +10.8% compared to a year earlier, the largest year-over-year increase since November 1980. Airline fares were up +33% year over year. However, prices for energy fell, along with prices for apparel, and used vehicles.
- The Producer Price Index (PPI) rose +0.5% rose for the month of April, in line with expectations and below March’s upwardly revised +1.6% increase. Core PPI, which excludes food and energy, gained +0.4% in April, below expectations of +0.7% and the prior month’s upwardly revised +1.2% increase. Compared to last year, PPI was +11.0% higher, above expectations of +10.7%, but below the prior month’s upwardly revised +11.5% rise. Core PPI increased at an annual rate of +8.8%, below expectations of +8.9% and well below March’s upwardly revised +9.6% increase.
- The National Federation of Independent Business (NFIB) Small Business Optimism Index for April remained at March’s 93.2 level, above expectations for a decrease to 92.9, but holding at the lowest level since April 2020 and its fourth consecutive month below the 48-year average of 98. Small businesses expecting better business conditions over the next six months fell to a net negative -50%, the lowest level recorded in the survey’s history. The NFIB said, “Small business owners are struggling to deal with inflation pressures, and the labor supply is not responding strongly to small businesses’ high wage offers and the impact of inflation has significantly disrupted business operations.”
- In the preliminary May University of Michigan Consumer Sentiment Index, sentiment fell more than expected, dropping to 59.1 from April’s final reading of 65.2, and far below the expectations for a decline to 64.0. The index fell back to a low not seen since 2011 as the expectations component of the report fell hard, as did the current conditions portion. Survey Director Joanne Hsu said inflation remains on the forefront of consumers’ minds, adding that respondents mentioned inflation throughout the survey, whether the questions referred to their own personal financial situations, their outlook for the economy, or buying conditions. The 1-year inflation expectation remained at +5.4%, versus the expected +5.5% rate, the highest since December 1981, and the 5-10 year inflation outlook held steady at +3.0% for the fourth-straight month.
- March Wholesale Inventories grew +2.3% for the month, unrevised from the previous report and where expectations were for it to remain, but below February’s 2.8% gain. Sales rose +1.7%, just below expectations of +1.8%, but up from February’s downwardly revised +1.5%.
- The weekly MBA Mortgage Application Index rose +2.0%, following the prior week’s increase of +2.5%, notching back-to-back weekly gains after seven straight weekly declines. The Refinance Index fell -2.0% but was more than offset by the Purchase Index which was up +4.5%. The average 30-year mortgage rate slipped by -1 basis point (bps) to 5.36% and remains up +219 bps from last year.
- Weekly Initial Jobless Claims were 203,000, for the week ended May 7, above expectations for 193,000 and the prior week’s upwardly revised 202,000. Continuing Claims for the week ended April 30 dropped by 44,000 to 1,343,000, below expectations of 1,372,000.
The Week Ahead
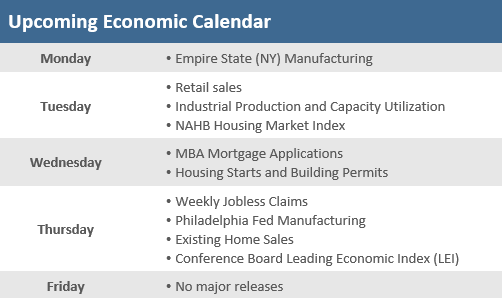
The calendar gets busier in the upcoming week but not terribly so. Retail sales and housing data are highlights of the economic reports. Regional Fed presidents have a busy week with New York Fed President John Williams speaking on Monday and St. Louis Fed President James Bullard, Philadelphia Fed President Patrick Harker, Cleveland Fed President Loretta Mester, and Chicago Fed President Charles Evans all making appearances on Tuesday. Fed Chairman Jerome Powell will also be featured at a conference sponsored by The Wall Street Journal on Tuesday. Some prominent retailers will be reporting earnings — Walmart, Home Depot, and Target — the last big reports of the first-quarter earnings season.
Did You Know?
BETTER BANKS – Through the first 4 months of 2022, no US bank had failed and required a financial bailout from the Federal Deposit Insurance Corporation (FDIC). There have been less than 10 banks that have failed in each of the last 7 calendar years, i.e., 2015-2021. 389 banks failed over the 3-year period 2009-2011 (source: FDIC, BTN Research).
CONTRARIANS – The S&P 500 was up +0.2% on a total return basis over the 1-year ending 4/30/2022. The last 7 times (taking place since 2010) that the index recorded a negative total return result over a trailing 12-month period, the index bounced back each time with a positive gain of at least +15% (total return) over the next 12 months. The 1-year average return of all 7 comebacks is +27.6% (total return) (source: BTN Research).
DECLINES HAPPEN – With its closing of 4,023 on Friday 5/13/2022, the S&P 500 index is down 18 % from an all-time closing high of 4797 set on 1/03/2022. The decline is the index’s 21st tumble of at least 10% (but less than 20%) in the last 50 years but is its 5th since 2015. Declines of at least 10% but less than 20% from a previous closing high are called “corrections” (source: BTN Research).
This Week in History
THE INTELLIGENGT INVESTOR WAS BORN – On May 9, 1894, Benjamin Grossbaum was born in London, to a homemaker and an importer of Austrian china. His family later changed its surname to Graham. Benjamin Graham is widely referred to as “the father of value investing” and is best known for his books, Security Analysis (published in 1934 with co-author David Dodd) and The Intelligent Investor (published in 1949), which are considered two of the most important finance and investment books published. Graham graduated from Columbia University in 1914 and went to work on Wall Street. He had a successful 15-year career and was able to build a sizable personal nest egg. However, Graham, like many others, lost most of his money in the stock market crash of 1929 and the subsequent Great Depression. Those experiences taught Graham the importance of minimizing downside risk by investing in quality companies that traded at a discount to their intrinsic value and provided the investor a margin of safety (source: The Wall Street Journal, Investopedia).
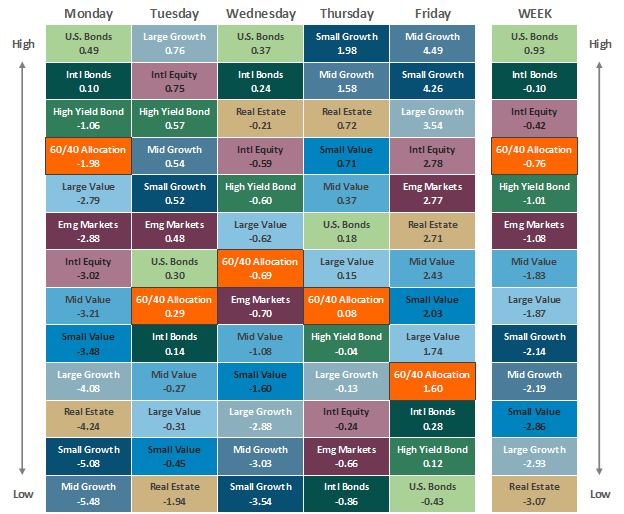
Asset Class Performance
Source: Bloomberg. Asset‐class performance is presented by using market returns from an exchange‐traded fund (ETF) proxy that best represents its respective broad asset class. Returns shown are net of fund fees for and do not necessarily represent the performance of specific mutual funds and/or exchange-traded funds recommended by The Retirement Planning Group. The performance of those funds may be substantially different than the performance of the broad asset classes and to proxy ETFs represented here. U.S. Bonds (iShares Core U.S. Aggregate Bond ETF); High‐Yield Bond (iShares iBoxx $ High Yield Corporate Bond ETF); Intl Bonds (SPDR® Bloomberg Barclays International Corporate Bond ETF); Large Growth (iShares Russell 1000 Growth ETF); Large Value (iShares Russell 1000 Value ETF); Mid Growth (iShares Russell Mid-Cap Growth ETF); Mid Value (iShares Russell Mid-Cap Value ETF); Small Growth (iShares Russell 2000 Growth ETF); Small Value (iShares Russell 2000 Value ETF); Intl Equity (iShares MSCI EAFE ETF); Emg Markets (iShares MSCI Emerging Markets ETF); and Real Estate (iShares U.S. Real Estate ETF). The return displayed as “Allocation” is a weighted average of the ETF proxies shown as represented by: 30% U.S. Bonds, 5% International Bonds, 5% High Yield Bonds, 10% Large Growth, 10% Large Value, 4% Mid Growth, 4% Mid Value, 2% Small Growth, 2% Small Value, 18% International Stock, 7% Emerging Markets, 3% Real Estate.
Chris Bouffard is CIO of The Retirement Planning Group (TRPG), a Registered Investment Adviser. He has oversight of investments for the advisory services offered through TRPG.
Disclaimer: Information provided is for educational purposes only and does not constitute investment, legal or tax advice. All examples are hypothetical and for illustrative purposes only. Past performance of any market results is no assurance of future performance. The information contained herein has been obtained from sources deemed reliable but is not guaranteed. Please contact TRPG for more complete information based on your personal circumstances and to obtain personal individual investment advice.

