Quick Takes
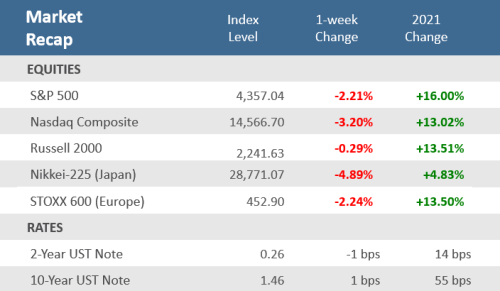
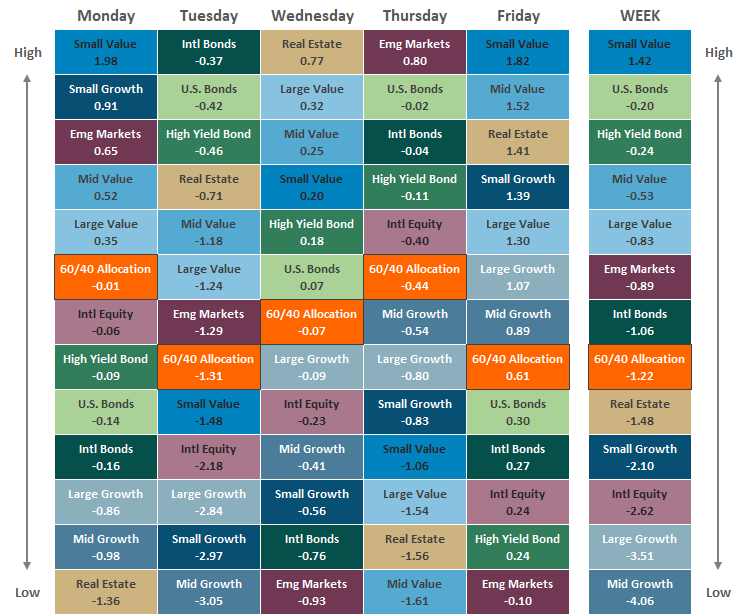
- Global equities were down for the week with the S&P 500, dropping -2.2%, while the tech-heavy Nasdaq Composite was down -3.2%. Small Cap Value was the only major asset class up on the week, gaining +1.4%. Mid Cap Growth suffered the most, falling -4.0%.
- The yield on the U.S. 10-year Treasury was as high as 1.56% during the week, before slipping back to close Friday at 1.46%, up a basis point for the week. Bonds declined on the week, with US and High Yield bonds down about -0.2% and world bonds were down -1.0%.
- In a busy week of economic data, results were mixed. Consumer Confidence fell and missed expectations while Consumer Sentiment unexpectedly rose. 2021-Q2 GDP surprised to the upside, while Core PCE (the Fed’s favored inflation measure) saw a 30-year high annual rise.
Stocks Slip in Wake of Rising Yields
It was another choppy week of trading for equity indices, with most global indices falling -2 to -4%. Yields continued to push higher which sent bond prices lower. U.S. stocks and bonds lost less than their overseas counterparts. Economic reports were heavy over the week in both the U.S. and overseas. A key measure of inflation watched by the Federal Reserve saw its largest annual gain since May 1991. Eurozone inflation was also strong, with its annual increase hitting a 13-year high. U.S. housing prices saw their largest year-over-year increases since data has been collected going back to 1987. Despite the very busy economic calendar, it was Washington that garnered much of the headlines as the US government flirted with a shutdown. Ultimately Congress passed a stopgap funding measure on Thursday to fund the government through early December, but legislators have yet to raise the country’s debt ceiling, which is expected to be reached by the third week of October. Progressive and moderate factions of the Democrat party could not agree on terms of the proposed $3.5 trillion spending bill, with many beltway pundits now expecting that figure to fall to the $1.5 to $2.1 trillion range for eventual passage.
Chart of the Week
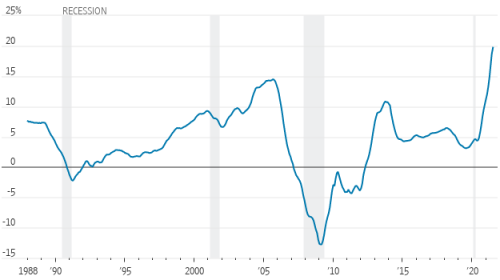
Surging home price gains have spurred concerns that a housing bubble is developing. The July 20-city composite S&P CoreLogic Case-Shiller Home Price Index hit a new all-time high, meeting the year-over-year forecasts for a +20.0% gain, and was up +1.6% on a month-to-month basis. July marked the highest annual rate of price growth since the index began in 1987. Similarly, the separate Federal Housing Finance Agency (FHFA) House Price Index was up +19.2% from July a year earlier, and +1.4% from the prior month. Home prices are a leading indicator and influence shelter costs that account for about a third of the CPI calculations. With a lag of at least a year, gains in these home price indices signal continued upward pressures for CPI inflation.
Record Home Price Gains Fuel Fears of a Bubble
S&P CoreLogic Case-Shiller National Home-Price Index, year-over-year % change
Source: S&P Dow Jones Indices, The Wall Street Journal.
Economic Review
August preliminary Durable Goods Orders were up +1.8% month-over-month, well ahead of expectations for a +0.7% gain, and up from July’s upwardly revised +0.5% gain.
The September Dallas Fed Manufacturing Index unexpectedly fell but remained in expansion territory (a reading above zero), falling to 4.6 from 9.0 in August and far behind forecasts for a rise to +11.0. The September Richmond Fed Manufacturing Activity Index unexpectedly fell into contraction territory (a reading below zero) down to -3 from 9 in August, and far below expectations for a reading of 10. It was the first negative reading since May.
The Conference Board’s Consumer Confidence Index fell to lowest level since February 2021, dropping to 109.3 in September from 115.2 in August (final upwardly revised reading). That was well below expectations of 115.0, and both the Present Situation subindex and the Expectations subindex for the next six months declined. Consumer confidence is still historically high and enough to support further growth in the near-term, but it is now -15% below its June peak.
Pending Home Sales rose +8.1% month-over-month in August, the first time in three months, and crushed estimates for a +1.4% gain. But sales fell -6.3% year-over-year which followed July’s negatively revised -9.6% drop. Sales were robust with increases in all four regions, led by the Midwest and South that were the biggest since June 2020.
Q2 Gross Domestic Product (GDP), the broadest measure of economic output, showed a quarter-over-quarter annualized rate of expansion of +6.7%, ahead of expectations for +6.6% growth and Q1’s rate of +6.3%. Personal Consumption was revised up to +12.0% for Q2 from the earlier estimate of +11.9%. Q1 consumption was unadjusted at an +11.4% gain. The Personal Consumption Expenditure (PCE) Price Index increased +0.4% for the month, above expectations for +0.3%. Excluding food and energy, the Core PCE Price Index (the Fed’s favored inflation measure) rose +0.3% for the month, above expectations for +0.2%, and + 3.6% higher over the last August, above expectations for +3.5%. The pandemic low base effects have now dropped out of the calculation, and the +3.6% year-over-year increase represents the largest annual increase in 30 years.
Initial Jobless Claims rose for a 3rd straight week, which hasn’t happened since April 2020, up +11,000 to 362,000, and higher than forecasts of 330,000 – but still remain near the lowest levels of the pandemic. Continuing Claims fell to 2.80 million, worse than the 2.79 million expected.
August Personal Income was up +0.2%, matching forecasts but is well below inflation so real (inflation-adjusted) income is falling. Personal Spending was up +0.8%, above estimates of +0.7%. The August Savings Rate as a percentage of disposable income was 9.4%. That’s above the historical average but dropped from 10.1% in July and is well below March’s 26.6% level and the all-time high of nearly 34% in April 2020, during the depths of the pandemic.
September US Manufacturing was stronger than expected in both the IHS Markit and the Institute of Supply Management (ISM) Purchase Manager Index (PMI) surveys. ISM manufacturing rose to 61.1 from 59.9 in August, beating expectations for 59.5. The separate IHS Markit manufacturing PMI surveys a broader group of companies than ISM and weights its components differently. It was revised higher to 60.7 from the initial 60.5 estimate. Levels over 50 represent economic expansion so both surveys portend strong, above-average growth.
The September final University of Michigan Consumer Sentiment Index was unexpectedly revised higher to 72.8 from the initial reading of 71, and above 70.3 in August.
August Construction Spending was unchanged from July’s unrevised 0.3% gain, in line with expectations.
The Week Ahead
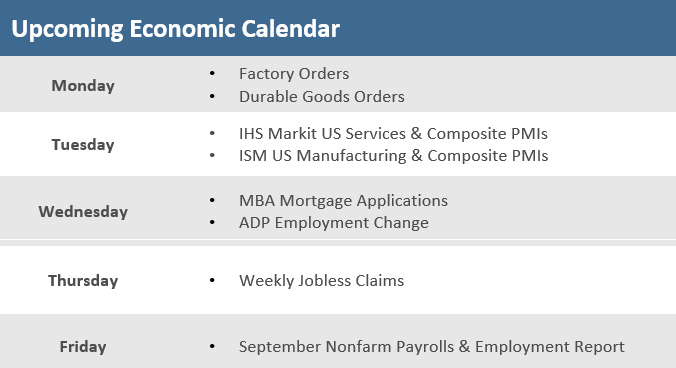
Aside from last-minute scrambling to prevent a government shutdown, important economic data being released this week include durable goods, consumer confidence, personal consumption, and the housing markets. To add to the busy economic calendar, there are several Federal Reserve members speaking during the week.
Did You Know?
RALLY TIME? — Over the last 30 years (1991-2020), the S&P 500 index has gained an average of +4.78% (total return) over the final 3 months of the year (October-November-December), the best of the calendar year quarters. 24 of the last 30 fourth quarters (80%) have produced a positive total return gain (source: BTN Research).
ROAD TO NOWHERE — A global computer chip shortage has slammed the auto sector this year as auto production has plunged by several million vehicles, which has erased billions in revenue for car companies. Originally thought to be a short-term supply crunch, many industry experts are now concerned it is turning into a structural hurdle that may take several years to overcome (source: The Wall Street Journal).
IN THE MIDDLE — After adjusting numerical data from the past for the impact of inflation, the US median household income reached an all-time high for 4 consecutive years (2016-2019), peaking at $69,560 in 2019. That streak ended in 2020 when median household income dropped to $67,521. Before 2016, the peak for median household income was $63,423 from 1999 (source: Federal Reserve Bank of St. Louis, BTN Research).
This Week in History
This week in 1720, after hitting nearly 1,000 in the summer, the price of South Sea Co. stock plunged to 180 a share on the London stock market. One legislator proposed tying each South Sea director up in a sack with a monkey and a snake, and throwing them into the river; angry mobs assaulted and nearly lynched stockbrokers in the streets (source: The Wall Street Journal).
Asset Class Performance
The Importance of Diversification. Diversification mitigates the risk of relying on any single investment and offers a host of long-term benefits, such as lowering portfolio volatility, improving risk-adjusted returns, and helping investments to compound more effectively.
Source: Bloomberg. Asset‐class performance is presented by using market returns from an exchange‐traded fund (ETF) proxy that best represents its respective broad asset class. Returns shown are net of fund fees for and do not necessarily represent performance of specific mutual funds and/or exchange-traded funds recommended by The Retirement Planning Group. The performance of those funds may be substantially different than the performance of the broad asset classes and to proxy ETFs represented here. U.S. Bonds (iShares Core U.S. Aggregate Bond ETF); High‐Yield Bond (iShares iBoxx $ High Yield Corporate Bond ETF); Intl Bonds (SPDR® Bloomberg Barclays International Corporate Bond ETF); Large Growth (iShares Russell 1000 Growth ETF); Large Value (iShares Russell 1000 Value ETF); Mid Growth (iShares Russell Mid-Cap Growth ETF); Mid Value (iShares Russell Mid-Cap Value ETF); Small Growth (iShares Russell 2000 Growth ETF); Small Value (iShares Russell 2000 Value ETF); Intl Equity (iShares MSCI EAFE ETF); Emg Markets (iShares MSCI Emerging Markets ETF); and Real Estate (iShares U.S. Real Estate ETF). The return displayed as “Allocation” is a weighted average of the ETF proxies shown as represented by: 30% U.S. Bonds, 5% International Bonds, 5% High Yield Bonds, 10% Large Growth, 10% Large Value, 4% Mid Growth, 4% Mid Value, 2% Small Growth, 2% Small Value, 31% International Stock, 7% Emerging Markets, 3% Real Estate.
Chris Bouffard is CIO of The Retirement Planning Group (TRPG), a Registered Investment Adviser. He has oversight of investments for the advisory services offered through TRPG.
Disclaimer: Information provided is for educational purposes only and does not constitute investment, legal or tax advice. All examples are hypothetical and for illustrative purposes only. Past performance of any market results is no assurance of future performance. The information contained herein has been obtained from sources deemed reliable but is not guaranteed. Please contact TRPG for more complete information based on your personal circumstances and to obtain personal individual investment advice.

