Quick Takes
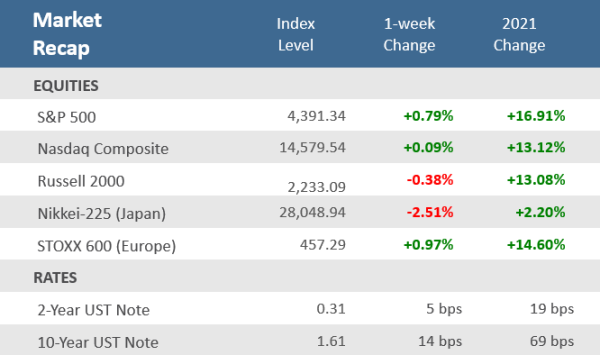
- Equities rebounded this week to help offset last week’s big drop. The S&P 500 gained +0.8% for its best week since August. Stocks started the week off with a pullback on Monday, but investors bought the dip as the CBOE Volatility Index (VIX) fell -19% Tuesday to Friday.
- The yield on the U.S. 10-year Treasury finished the week at 1.61%, its highest level since June. That drove the Bloomberg Barclays US Aggregate Bond Index down -0.6% for the week, its fourth straight weekly decline, and the biggest drop since the first week of March.
- It was a slow week for economic data, highlighted by upward surprises in service sector growth but also a big downward surprise in jobs creation. Brinkmanship over the debt-ceiling filled in for the light economic calendar, with the Senate ultimately agreeing to extend the debt ceiling until December 3.
Value stocks lead rebound, yields hit highest levels since June
Most major U.S. stock averages ended positive for the week. The S&P 500 rose +0.8% for its best week since, and the Dow was up +1.2% for its best week since June. The tech-heavy Nasdaq was only up +0.1% as growth styles like technology underperformed value styles such as energy and financial, which were the two best sectors for the week with gains +5.0% and +2.3%, respectively. Small-cap stocks were the exception to the positive week as they fell -0.4%. Upward pressure on interest rates continues, with the 10-year Treasury yield rising to 1.61% this week, as persistently high inflation readings have started to spook the bond market. That’s the highest level for yields since June.
In addition to inflation, there are still several clouds hanging over the markets, such as supply chain issues, China credit issues, and geopolitical flare-ups, among others – but one market uncertainty was removed during the week, albeit only temporarily. On Thursday, the Senate passed a bill to extend the debt ceiling by $480 billion until December 3. The bill now moves to the House, where it is expected to be passed early next week. So investors, and the general public, get a few weeks of reprieve from the histrionics and brinksmanship from U.S. lawmakers before the debt-ceiling suddenly becomes a crisis again.
Chart of the Week
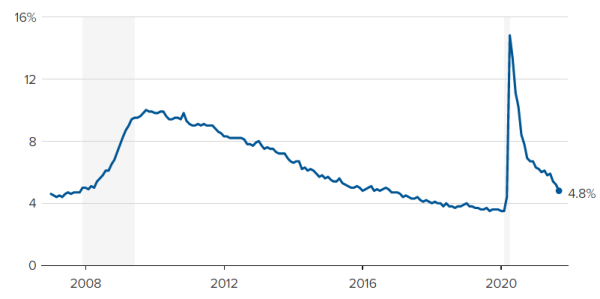
The September Nonfarm Payrolls Employment Report was a bit of a mixed bag. Headline job creation badly missed expectations, as nonfarm payrolls rose 194,000 versus expectations for 500,000 new jobs. Leisure and hospitality, professional and business services, and retail sectors led the job creation. Some of the disappointment was due to the seasonal adjustment which is often buoyed by public schools as districts rehire teachers, bus drivers, and school administrators. But this September those government jobs were a drag on the report. Despite the weak job growth, the unemployment rate fell to 4.8%, better than the forecast of 5.1%. Wages increased sharply, as the monthly wage gain of +0.6% pushed the year-over-year increase to +4.6%. Companies are relying on higher pay to overcome the persistent labor shortage. Regarding the labor shortage, the available workforce declined by 183,000 in September and is 3.1 million shy of where it was in February 2020, just before the pandemic was declared.
U.S. Unemployment Rate
The unemployment rate dropped to 4.8%, better than the expected 5.1%.
Note: Shaded areas indicate U.S. recessions. Data is seasonally adjusted.
Source: Bureau of Labor Statistics, CNBC.
Economic Review
Factory Orders rose +1.2% in August from July, beating expectations of +1.0%, and above July’s upwardly revised +0.7% increase. On a year-over-year basis, Factory Orders were up +16.0%.
Durable Goods Orders were unrevised from last week’s preliminarily of +1.8%. Excluding transportation, orders were upwardly adjusted to +0.3%. Finally, nondefense capital goods orders excluding aircraft—considered a proxy for capital spending—were revised higher from a +0.5% gain to a +0.6% rise.
The September ISM US Services Purchase Managers Index (PMI) remained well into expansion (a reading above 50) rising to 61.9 from 61.7 in August, and the forecast for a decline to 59.9. The ISM said, “The slight uptick in the rate of expansion in the month of September continued the current period of strong growth for the services sector. However, ongoing challenges with labor resources, logistics, and materials are affecting the continuity of supply.”
The final September Markit US Services PMI was revised up slightly to 54.9 from the preliminary estimate of 54.4, where it was expected to remain. That’s down from 55.1 in August. Markit separates from the ISM and differs because it has less historic value and Markit weights its index components differently and includes small and medium-sized companies.
The September ADP Employment Change report rose by +568,000 private-sector payrolls, above expectations of a 430,000 gain. August data was revised up to 374,000 jobs from 340,000. ADP’s data does not include government jobs, which differs from the broader Nonfarm Payroll report discussed in the Chart of the Week above.
Initial Jobless Claims fell to 326,000 from an upwardly revised 364,000 the prior week, and better than the forecast of 348,000. Continuing Claims fell by 97,000 to 2.714 million, better than the 2.766 million expected.
The Week Ahead
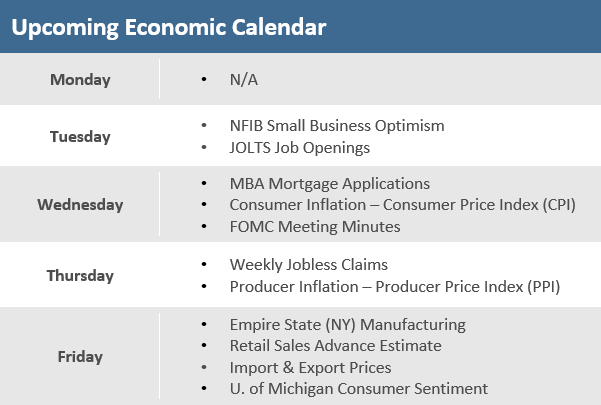
The bond market is closed on Monday for Columbus Day, while the stock market will be open. The unofficial start to Q3 earnings season starts when the big banks begin reporting this week. It is also options expiration on Friday. A big focus for the week will be CPI inflation report on Wednesday. A lot of signs of elevated price pressures will have investors watching for indications that inflation may be more than transitory and spreading beyond the pandemic-related sectors. All of those have the potential to be catalysts for additional choppiness in the markets.
Did You Know?
STOCKS & WHITE HOUSE — From 1936-2020, the S&P 500 has averaged +6.7% per year (total return) during the 1st year of a 4-year presidential term, +8.7% per year during the 2nd year, +18.5% per year during the 3rd year, and +9.8% per year during the 4th year. 2022 will be year # 2 of a 1st-term Biden administration. Through 10/8 the S&P 500 is up 18.2% in 2021 with dividends reinvested (source: BTN Research, Bloomberg).
BOAT TO NOWHERE — 73 vessels were anchored and awaiting entry into the ports of Long Beach and Los Angeles on Sunday 9/19/21, an all-time record. An additional 37 vessels were drifting in the ocean within 20 miles of Long Beach and Los Angeles, but far enough offshore to prevent them from successfully dropping an anchor (source: Marine Exchange of Southern California, BTN Research).
(NOT SO) GREAT EXPECTATIONS — 53% of consumers surveyed in August 2021 believe the “average income tax rate” paid by American taxpayers will increase in the next 12 months. The 53% result is the highest level recorded in a monthly survey that has been conducted since 2015 (source: Survey of Consumer Expectations, BTN Research).
This Week in History
This week in 1896, the Dow Jones Industrial Average began continuous daily publication. Its 12 members were the great industrial giants of the time: American Cotton Oil, American Sugar, American Tobacco, Chicago Gas, American Spirits Manufacturing, General Electric, Laclede Gas, National Lead, U.S. Cordage, Tennessee Coal & Iron, U.S. Leather, and U.S. Rubber (source: The Wall Street Journal).
Asset Class Performance
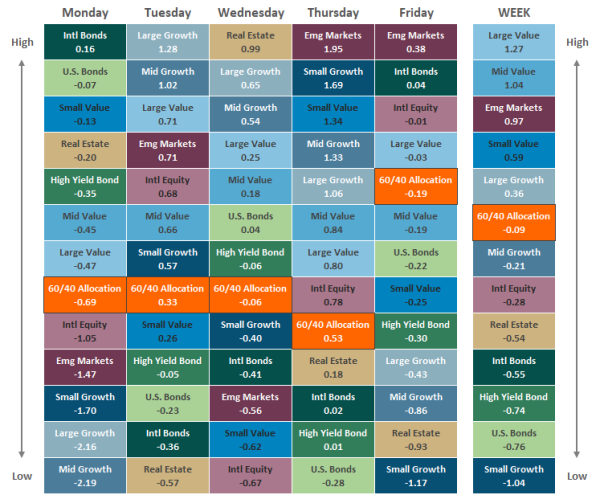
The Importance of Diversification. Diversification mitigates the risk of relying on any single investment and offers a host of long-term benefits, such as lowering portfolio volatility, improving risk-adjusted returns, and helping investments to compound more effectively.
Source: Bloomberg. Asset‐class performance is presented by using market returns from an exchange‐traded fund (ETF) proxy that best represents its respective broad asset class. Returns shown are net of fund fees for and do not necessarily represent the performance of specific mutual funds and/or exchange-traded funds recommended by The Retirement Planning Group. The performance of those funds may be substantially different than the performance of the broad asset classes and to proxy ETFs represented here. U.S. Bonds (iShares Core U.S. Aggregate Bond ETF); High‐Yield Bond (iShares iBoxx $ High Yield Corporate Bond ETF); Intl Bonds (SPDR® Bloomberg Barclays International Corporate Bond ETF); Large Growth (iShares Russell 1000 Growth ETF); Large Value (iShares Russell 1000 Value ETF); Mid Growth (iShares Russell Mid-Cap Growth ETF); Mid Value (iShares Russell Mid-Cap Value ETF); Small Growth (iShares Russell 2000 Growth ETF); Small Value (iShares Russell 2000 Value ETF); Intl Equity (iShares MSCI EAFE ETF); Emg Markets (iShares MSCI Emerging Markets ETF); and Real Estate (iShares U.S. Real Estate ETF). The return displayed as “Allocation” is a weighted average of the ETF proxies shown as represented by: 30% U.S. Bonds, 5% International Bonds, 5% High Yield Bonds, 10% Large Growth, 10% Large Value, 4% Mid Growth, 4% Mid Value, 2% Small Growth, 2% Small Value, 18% International Stock, 7% Emerging Markets, 3% Real Estate.
Chris Bouffard is CIO of The Retirement Planning Group (TRPG), a Registered Investment Adviser. He has oversight of investments for the advisory services offered through TRPG.
Disclaimer: Information provided is for educational purposes only and does not constitute investment, legal or tax advice. All examples are hypothetical and for illustrative purposes only. Past performance of any market results is no assurance of future performance. The information contained herein has been obtained from sources deemed reliable but is not guaranteed. Please contact TRPG for more complete information based on your personal circumstances and to obtain personal individual investment advice.


