Market Performance Summary
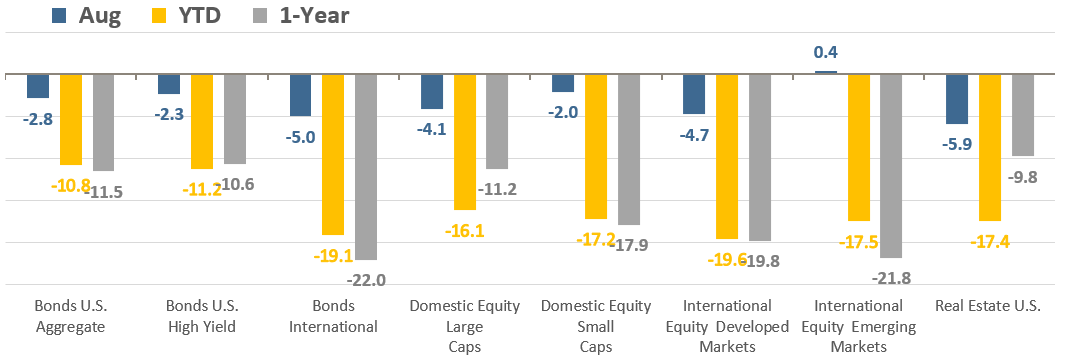
For markets in August, it was a tale of two halves. The first half of the month saw an extension of the impressive July rally, as most risk assets continued to make gains. However, the second half saw risk assets experience their biggest pullback in a couple of months as growth concerns and aggressive monetary policy by central banks had investors on the run. Overall, all major asset classes except emerging markets were negative for the month.
Asset Class Total Returns
SSource: Bloomberg, as of August 31, 2022. Performance figures are index total returns: U.S. Bonds (Barclays U.S. Aggregate Bond TR), U.S. High Yield (Barclays U.S. HY 2% Issuer-Capped TR), International Bonds (Barclays Global Aggregate ex USD TR), Large Caps (S&P 500 TR), Small Caps (Russell 2000 TR), Developed Markets (MSCI EAFE NR USD), Emerging Markets (MSCI EM NR USD), Real Estate (FTSE NAREIT All Equity REITS TR).
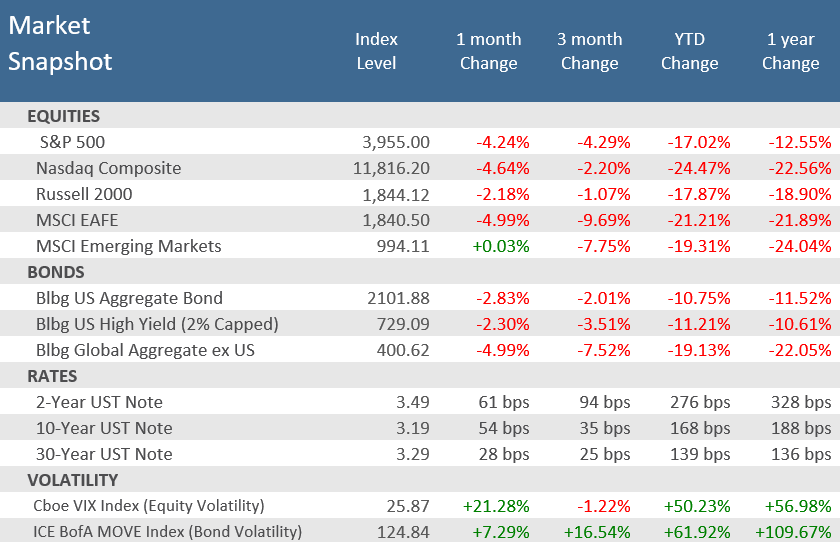
U.S. small-cap stocks fared the best, but the Russell 2000 Index still shed -2.2%. The U.S. benchmark S&P 500 Index lost nearly twice as much, falling -4.2%. The Nasdaq Composite fell the most, as tech stocks—which are more susceptible to rising interest rates—sold off sharply toward the end of the month to send the index down -4.5% for August. It wasn’t any better for international developed markets as the MSCI EAFE Index sank -4.7%. It was only emerging market equities that were able to buck the downtrend, albeit with a very slim +0.4% advance that the MSCI Emerging Markets Index managed to eke out. The high commodity prices that are fueling inflation in most developed nations actually benefit many emerging economies that are commodity exporters.
Usually, bonds help shelter investors from turmoil in equity markets but that wasn’t the case in August 2022. With the Federal Reserve determined to remain hawkish, interest rates resumed their ascent, and the yield curve remained inverted (i.e. long-term yields are lower than short-term yields). U.S. Treasury bonds recorded their most significant monthly loss since April. The benchmark 10-year U.S. Treasury yield closed August at 3.19%, up from 2.65% at the end of July, but—for the second month in a row—its yield remained below the 6-month, 1-year, 2-year, and 5-year yields. Of course, for bonds, higher yields mean lower prices which resulted in the Bloomberg U.S. Aggregate Bond Index losing -2.8% in August. But it was international bonds that really suffered, down -5.0% for the month. Overseas bonds suffered from the double whammy of both rising yields as well as a rising U.S. dollar.
Source: Bloomberg.
Price Returns for Equity, Total Returns for Bonds.
Quick Takes
Don’t Fight the Fed.
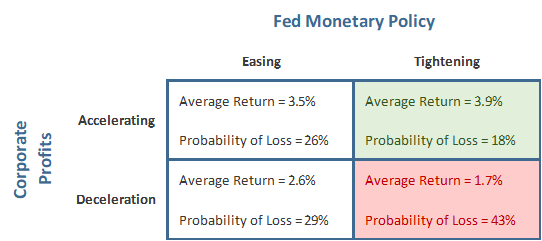
One of the top rules in investing is “Don’t Fight the Fed”. The Federal Reserve provides markets liquidity directly and indirectly. By purchasing or selling bonds, they directly impact the number of investable dollars available to markets. Raising and lowering interest rates indirectly affect market liquidity. Many market participants were positioning for the Fed to soften its stance with regards to monetary policy early in August, thinking the decelerating economy and signs that inflation had peaked would result in a more dovish Fed approach. However, Fed Chairman Jerome Powell put an end to that speculation in a concise and candid speech at the annual Jackson Hole Economic Symposium on August 25th. His comments let the markets know—despite recent declines in several gauges of inflation—that the central bank’s rate-hiking isn’t close to being completed. After being far too dovish for far too long, the Fed has now shifted to the other extreme. After dismissing inflationary pressures for virtually all of 2021, in 2022 the Fed has spearheaded one of the most aggressive rate hiking cycles, in a very short period of time, in history. The Fed started its indirect tightening campaign with rate hikes in March (25bps), May (50bps), June (75bps), and July (75bps). And in Powell’s Jackson Hole speech, he signaled more was on the way, making clear that the Fed is willing to sacrifice the economy to combat inflation and acknowledged that could bring “pain” to households and the labor market. The economy has already decelerated, as evidenced by the negative GDP readings in Q1 and Q2, but also seen in the decelerating growth of corporate profits over the last several quarters. For investors, that will mean recalibrating expectations until the Fed actually does pivot to a more dovish stance. As seen in the table below, the mix of the Fed tightening monetary policy combined with decelerating corporate profits results in the weakest average annual returns for stocks along with the highest probability of loss.
S&P 500 Quarterly Total Returns
(March 1971 – June 2022)
Source: Richard Bernstein Advisors, LLC., FRB, S&P Global, Bloomberg.
A Tale of Two Halves.
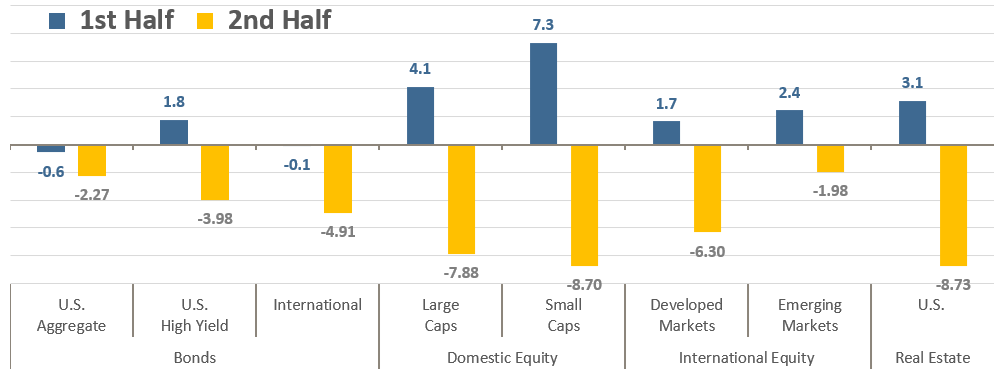
Capital markets were whipsawed in August, as traders quickly recalibrated from July’s enthusiasm for a Fed pivot to softer, less aggressive monetary policy to mid-August’s decidedly more aggressive rate-hike expectations as the Fed, and central banks across the globe vowed to step up their efforts to fight inflation. In the first week of August, many market pundits were predicting the beginning of a new bull run and stocks were building on their impressive July gains. As seen in the blue bars on the chart below, most major asset classes were sitting on solid gains at mid-month. However, investors’ appetite for risk assets in the first half of the month began to reverse mid-month as Fed officials began to signal a dovish Fed pivot wasn’t imminent and then evaporated entirely in the days following Powell’s Jackson Hole message, when the losses quickly overcame the mid-month gains, and then some.
August 2022 Total Returns
Capital markets sink in the back half of August
Source: Bloomberg. First half, Aug 1 – Aug 15; second half, Aug 16 – Aug 31.
2-Year Treasury Yield Takes Off.
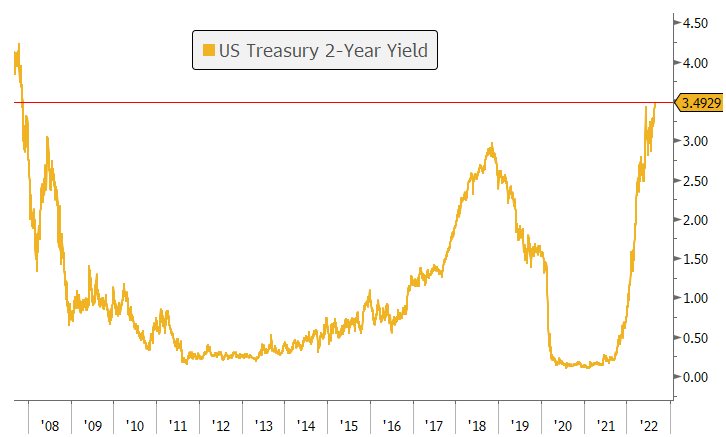
With the Fed’s urging, markets now see higher interest rates and slower economic growth ahead than they did coming into August. The 2-year Treasury yield started August at 2.88% and finished the month at 3.49%—its highest level since November 2007. That reflects investors’ expectations for the near-term path of Fed policy with the futures markets pricing in a 68.5% probability that the Fed will raise interest rates by another 75 basis points to a range between 3% and 3.25% at its September 20-21 meeting and then peaking at a target range of 3.75% to 4.00% in the first half of next year.
2-Year Treasury Yield Hits 3.5%
Highest since November 2007
Source: Freddie Mac, Bloomberg. Data as of August 4, 2022.
Dollar Dominance.
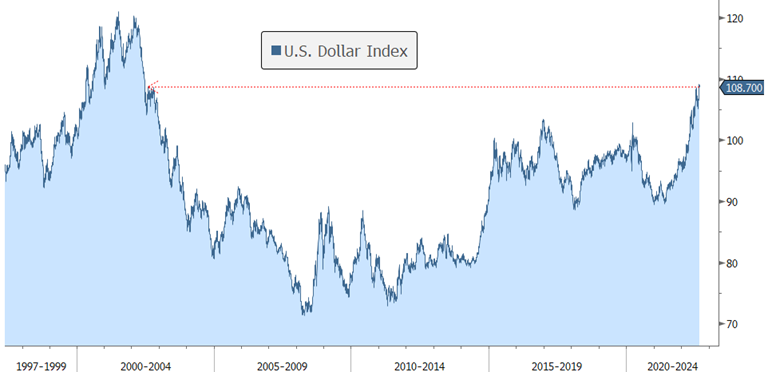
Fears of a global recession, deepening woes in Europe, and investors seeking shelter from stock declines are pushing the dollar higher, and there are few indications that it will change its trajectory anytime soon. The dollar’s strength is a double-edged sword for U.S. consumers and businesses. It tends to boost consumption domestically but detracts from multinational firms’ overseas revenue. For example, since the recent low of the U.S. Dollar on January 5th, 2021, through August 31, 2022, the Russell 1000 Index (essentially the largest U.S. companies by market capitalization) has risen +3.4%. But according to an analysis by Bespoke Investment Group, the average gain for Russell 1,000 stocks that derive more than 90% of their revenues in the U.S. are up an average +15.7%, while the average gain for Russell 1,000 stocks with at least 50% of their revenues generated internationally is only +2.8%. The market is clearly rewarding those firms with domestic revenues. For some foreign currencies, the dollar disparity has really swelled. For instance, the Japanese yen has dropped to a 24-year low versus the U.S. dollar, having fallen nearly -20% against the dollar just since the start of this year. The dollar’s ascension has also been quite painful for many emerging economies. According to JPMorgan Chase, many developing countries are drawing down their foreign currency reserves at a rate not seen since 2008, raising the risk of a wave of defaults (think of currency reserves like an insurance policy for your home in case it catches on fire). Emerging nations need U.S. dollars because that’s how they pay interest on their overseas bonds, and that’s also how they finance imports. For most TRPG clients, we are underweight non-U.S. stocks, at about 20% of equity allocations, versus pure passive portfolios which would have about 40% of their equity allocation in non-U.S. stocks according to the MSCI All Country World Index.
Dollar Notches 20-Year High
U.S. Dollar Index (DXY)
Source: Bloomberg.
Global Bond Funds Get a Bear Hug.
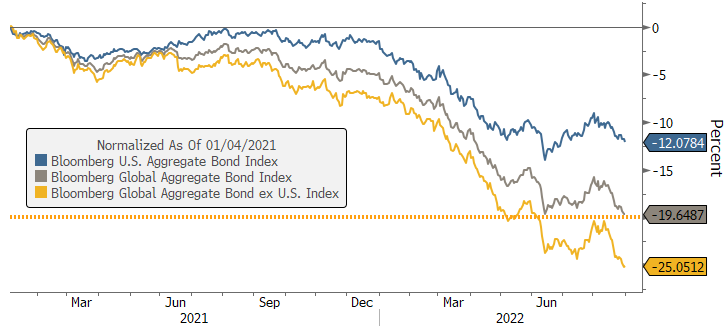
With central bankers determined to quash inflation, even at the cost of a recession, and the U.S. dollar at 20-year highs, global bonds slumped towards their first bear market (a decline exceeding -20%) in a generation. At the end of August, the Bloomberg Global Aggregate Bond Index was down -19.6% from its all-time high on January 4, 2021. It hasn’t been a cakewalk for U.S. bond investors, but the benchmark U.S. Aggregate Bond Index is down much less in comparison, at -12.1%. For international bonds (i.e. global bonds excluding the U.S.) it’s been particularly painful as they’ve suffered a -25.1% drawdown from the 1/4/2021 peak. For most TRPG client accounts we removed non-U.S. bonds from portfolios in March.
Global Bonds Enter Bear Market
Global bonds down more than -20% from 2021 highs
Source: Bloomberg. Data as of August 31, 2022.
Jobs Recovery Finally Recovers Pandemic Losses.
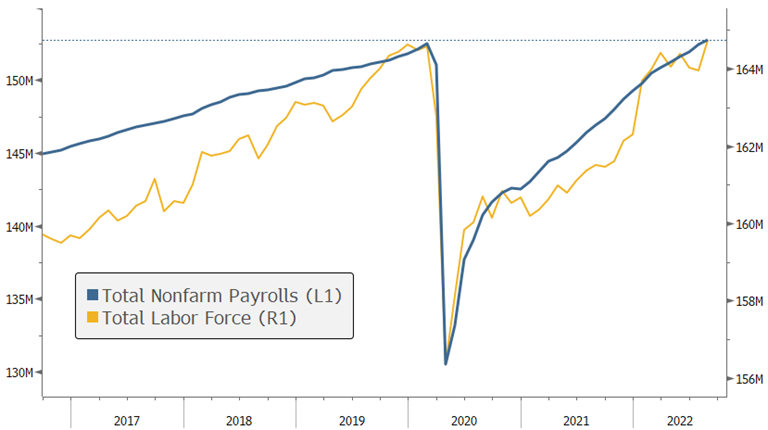
In what was deemed “A Goldilocks Report”, the August Employment Report from the Bureau of Labor Statistics showed widespread, broad-based gains of jobs across industries. Headline non-farm payrolls increased by 315,000, beating expectations, but a bigger surprise was the jump in the labor participation rate which reversed a downward trend for most of the year. So overall, we’re looking at a labor market that has finally put the pandemic behind it. Looking forward, it will be important to see how much “pain” the Fed is willing to inflict on the economy and labor market to control inflation and whether the pre-pandemic employment levels can hold.
The Labor Market is Back to Pre-Pandemic Levels
Total Labor Force recovers pandemic losses
Source: Bloomberg, Bureau of Labor Statistics.
Looking Forward.
Historically, August and September are two of the weakest months of the year. It tends to be a time of seasonal volatility and that may be exacerbated this year from the additional cross-currents of midterm elections and peak Fed hawkishness, as well as other major global central bank rate hikes hanging over the market. According to CFRA data, since World War II the S&P 500 has been down 56% of the time in September, and it averages a -0.56% decline. Theories as to why September is traditionally so weak include the tendency for many professional traders and investors to reassess their portfolio positioning as they return from their summer vacations, corporate budgets are often prepared for the coming year in the fall and companies consider the need to “tighten their belts”, and it is near the end of the fiscal year for many mutual funds that often engage in “window dressing” (i.e. selling positions they hold at a loss to reduce the size of their annual capital-gains distributions). Although September has historically been the worst month for stocks, October averages a +0.9% gain, and November and December have averaged gains of +1.4% and +1.6% respectively. November and December have also had the highest percentage of gains at 66% and 77%. As shown in the chart below, the late-year gains have historically been even higher during midterm years.
Stock Seasonality is Challenged in September but Favorable in the Fourth Quarter
S&P 500 Index Average Monthly Returns (1950 – 2021)
Source: YCharts, Carson Investment Research.
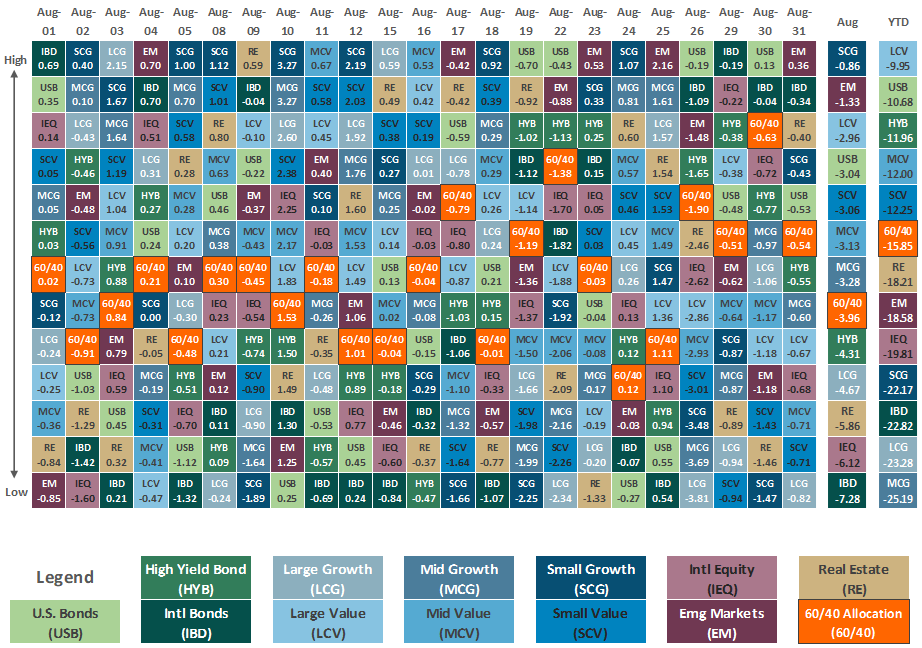
Asset Class Performance
The Importance of Diversification. Diversification mitigates the risk of relying on any single investment and offers a host of long-term benefits, such as lowering portfolio volatility, improving risk-adjusted returns, and helping investments to compound more effectively.
Source: Bloomberg. Asset‐class performance is presented by using market returns from an exchange‐traded fund (ETF) proxy that best represents its respective broad asset class. Returns shown are net of fund fees for and do not necessarily represent performance of specific mutual funds and/or exchange-traded funds recommended by The Retirement Planning Group. The performance of those funds may be substantially different than the performance of the broad asset classes and to proxy ETFs represented here. U.S. Bonds (iShares Core U.S. Aggregate Bond ETF); High‐Yield Bond (iShares iBoxx $ High Yield Corporate Bond ETF); Intl Bonds (SPDR® Bloomberg Barclays International Corporate Bond ETF); Large Growth (iShares Russell 1000 Growth ETF); Large Value (iShares Russell 1000 Value ETF); Mid Growth (iShares Russell Mid-Cap Growth ETF); Mid Value (iShares Russell Mid-Cap Value ETF); Small Growth (iShares Russell 2000 Growth ETF); Small Value (iShares Russell 2000 Value ETF); Intl Equity (iShares MSCI EAFE ETF); Emg Markets (iShares MSCI Emerging Markets ETF); and Real Estate (iShares U.S. Real Estate ETF). The return displayed as “Allocation” is a weighted average of the ETF proxies shown as represented by: 30% U.S. Bonds, 5% International Bonds, 5% High Yield Bonds, 10% Large Growth, 10% Large Value, 4% Mid Growth, 4% Mid Value, 2% Small Growth, 2% Small Value, 18% International Stock, 7% Emerging Markets, 3% Real Estate.
Chris Bouffard is CIO of The Retirement Planning Group (TRPG), a Registered Investment Adviser. He has oversight of investments for the advisory services offered through TRPG.
Disclaimer: Information provided is for educational purposes only and does not constitute investment, legal or tax advice. All examples are hypothetical and for illustrative purposes only. Past performance of any market results is no assurance of future performance. The information contained herein has been obtained from sources deemed reliable but is not guaranteed. Please contact TRPG for more complete information based on your personal circumstances and to obtain personal individual investment advice.

