Market Performance Summary
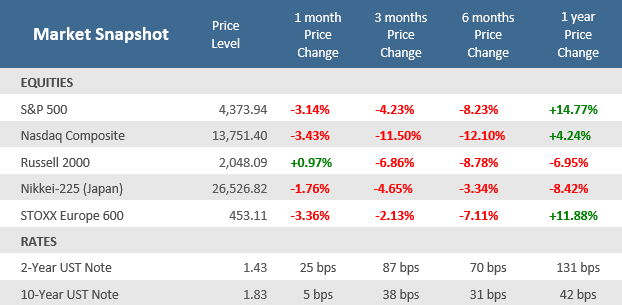
It was another difficult month for bond and equity investors. After watching virtually all major asset classes fall in January, February brought a similar trend, though at a lesser magnitude. Inflation anxieties remain but geopolitical risks took center stage with Russia’s troubling decision to invade Ukraine, exposing an already choppy market environment to yet another upsurge in volatility.
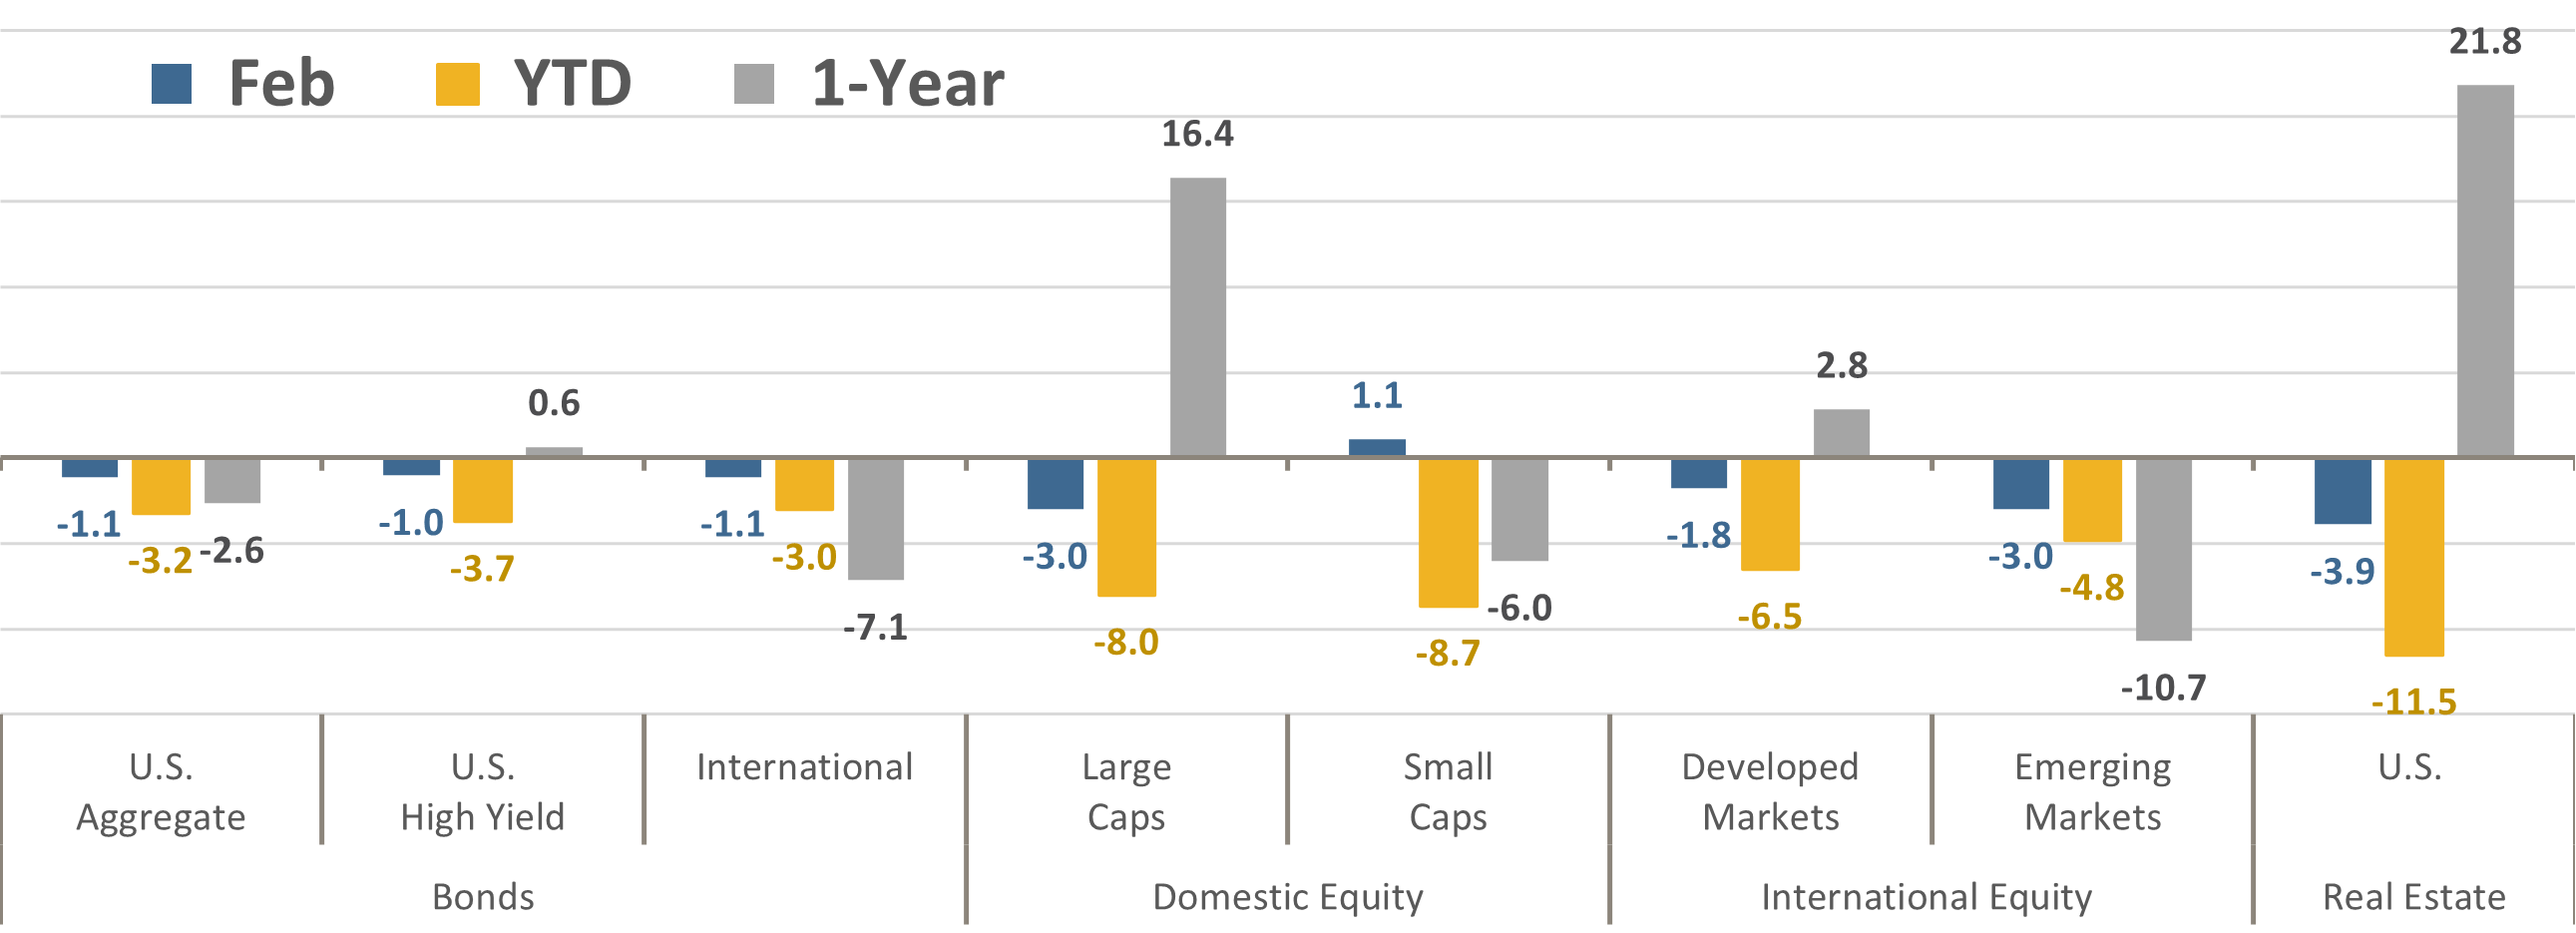
Asset Class Total Returns
Source: Bloomberg, as of February 28, 2022. Performance figures are index total returns: U.S. Bonds (Barclays U.S. Aggregate Bond TR), U.S. High Yield (Barclays U.S. HY 2% Issuer-Capped TR), International Bonds (Barclays Global Aggregate ex USD TR), Large Caps (S&P 500 TR), Small Caps (Russell 2000 TR), Developed Markets (MSCI EAFE NR USD), Emerging Markets (MSCI EM NR USD), Real Estate (FTSE NAREIT All Equity REITS TR).
U.S. large cap stocks, as measured by the S&P 500, lost -3.0% on a total return basis (reinvesting dividends), and at one point in late February it fell into correction territory (a decline of -10%) for the first time in nearly two years. In a reversal from recent trends, smaller capitalization stocks were the top asset class in February, managing to advance +1.1% over the month. It was the first time in five months that the small cap Russell 2000 Index outperformed the large cap S&P 500 Index, and by the widest margin since January 2021. Real Estate still has the best trailing one-year performance but continued to give up that advantage with a -3.9% decline in February, following the -7.9% drop suffered in January. Not surprisingly, the downside hit markets closer to the Russia-Ukraine conflict hard. The MSCI Europe Index was down -3.1% in U.S. dollar terms, the third decline in the last four months.
Normally, one would expect the prospect of the worst European geopolitical event since World War II to spur a stronger rally in safe haven assets like bonds, but the Bloomberg US Aggregate Bond Index fell -1.1% in February. That was the sixth decline in seven months and puts the headline bond index at its worst start to a year since 1980. Late in the month the 10-year U.S. Treasury yield rose above 2% for the first time since July 2019, but then tumbled 14 basis points on the final trading day of February as the full-scale Russian invasion of Ukraine prompted a flight to safety. Emerging market bonds fell hard, losing -4.5%, their worst month since March 2020 when COVID was first breaking out.
The combination of stocks and bonds both being down in January and February has been a rare double whammy for diversified portfolios. Indeed, since 1976 there has only been one other instance in which the S&P 500 and the Bloomberg Aggregate Bond Index were both down in January and February: 2009. In 2009 the subsequent March return was positive for both the S&P 500 (+8.5%) and Bloomberg Aggregate (+1.4%) and the full calendar year return was +23.5% for the S&P 500 and +5.9% for the Bloomberg Aggregate.
Source: Bloomberg.
Quick Takes
The Russia – Ukraine conflict.
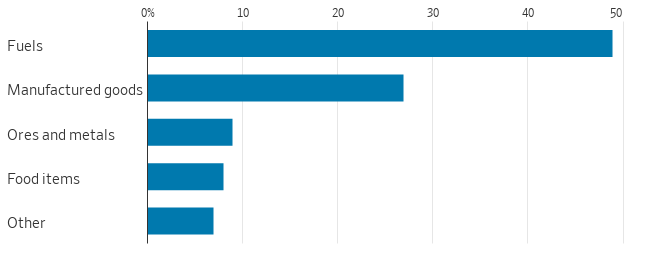
The impact of the Russia – Ukraine conflict remains highly uncertain. At this stage the clearest economic consequence for markets is related to energy and food prices. J.P. Morgan points out that Russia is a significant exporter of commodities, accounting for 13% of global crude oil production, 17% of natural gas production and nearly a tenth of global wheat supplies. Brent oil ended February at $100 per barrel and European natural gas prices rose 15% in February. Higher energy prices could fuel higher or at least more persistent inflation and pressure consumer spending. It’s not yet clear how central banks will react to higher energy prices and likely depends on whether higher energy prices crimp economic growth or spark another inflation surge. Bond markets did scale back what they were pricing in for 2022 rate hike expectations towards the end of the month.
Russian Exports by Type, 2020
Source: UN Conference on Trade and Development, The Wall Street Journal.
Beginning of the End?
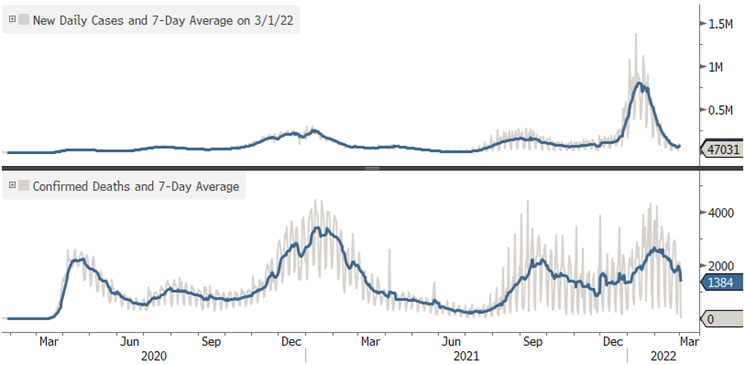
U.S. case counts are now below where they were prior to the Omicron wave, at their lowest levels since last July, and virtually every other metric is falling as well. ICU uptake is the lowest since last summer’s Delta wave was breaking out. Deaths have rolled over and are following other metrics lower at a lag. The Omicron wave appears to be over with even New York State lifting their mask mandate.
COVID cases are down about 95% from their January peak
Source: Bloomberg, The Retirement Planning Group.
What a Drag.
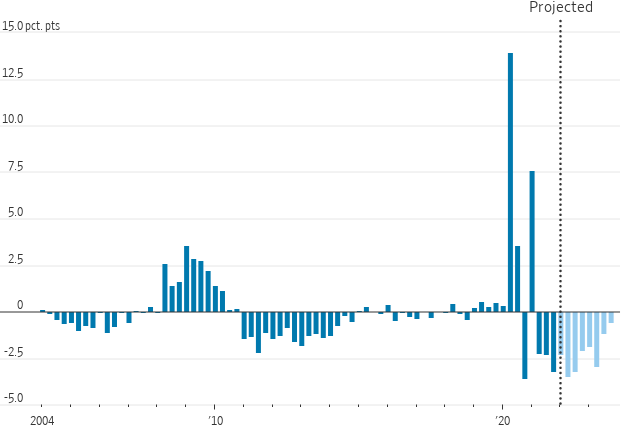
The Federal support that was issued to boost the economy in the wake of the pandemic was provided at an unprecedented rate and magnitude. The Wall Street Journal calculates that roughly $3.6 trillion in federal spending was provided since the start of the pandemic in early 2020. The various relief bills were broad-based with direct support to households via stimulus checks, enhanced unemployment benefits, monthly child tax-credit payments, and aid to state and local governments. Fueled by all the fiscal aid, inflation-adjusted U.S. Gross Domestic Product (GDP), the broadest measure of economic output, rose +5.5% in the fourth quarter of 2021 from the same period a year earlier, its best annual rate since 1984. According to Goldman Sachs, by the end of 2021 the various Covid-19 relief packages enacted since 2020 had boosted GDP by just under 6 percentage points. But Goldman’s chief economist now estimates are that by the end of 2022 that GDP boost will shrink to a little less than 2 percentage points, or the equivalent of a 4 percentage point “deficit” to economic growth. The median estimate of fourth quarter 2022 GDP growth by 59 economists surveyed by Bloomberg is +2.5%. Despite calls from some industry groups for additional aid, a bitterly divided Congress is unlikely to pass another large-scale relief package as inflation pressures intensify and mid-term elections loom.
Fiscal Stimulus Is Turning into a Fiscal Drag, a Headwind for Future Growth
Fiscal policy contributions to quarterly gross domestic product (GDP) growth
Note: Contributions are at an annual rate and reflect impact of local, state and federal tax and spending policy.
Source: Hutchins Center on Fiscal and Monetary Policy, The Wall Street Journal.
U.S. Consumer to the Rescue?
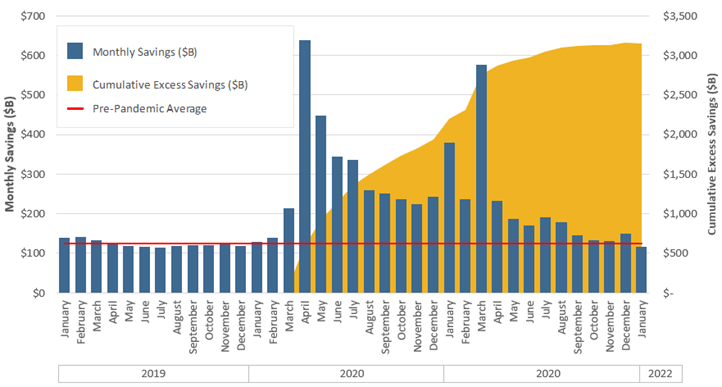
Even with the flood of federal COVID relief spending heaped on U.S. consumers over the last two years, many began saving in a big way. Whether it was because of lockdowns, low inventory from supply chain issues, or just a fiscally conservative mentality from the pandemic, Americans saved a lot of money. Calculating anything saved above and beyond the pre-pandemic average monthly savings, Americans have stashed away over $3 trillion of excess accumulated savings. Consumer spending accounts for about 70% of U.S. GDP, making it a vital aspect of economic growth. With the tailwind of COVID-related fiscal stimulus running low that pent up savings may serve to support consumer spending for quarters – or even years – to come. And with COVID cases now down 95% from their January peak, again the lowest levels since last summer, a return to travel, entertainment, and restaurants may grow.
Consumers’ Cup Runneth Over
Personal and Excess Savings ($ USD billions)
Pre-Pandemic Average represents the average monthly savings from January 2019 to February 2020.
Excess savings represents dollars saved above the average monthly savings from January 2019 to February 2020.
Source: Bureau of Economic Analysis, Bloomberg, The Retirement Planning Group.
Less is More.
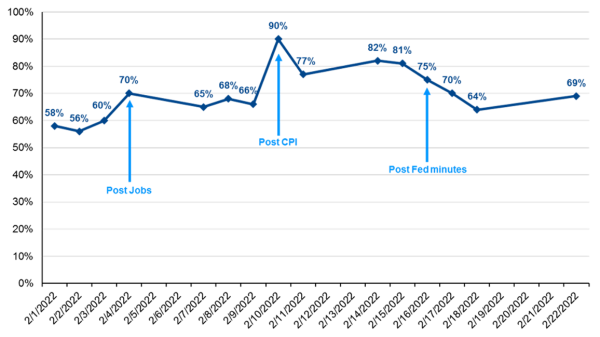
In mid-December Federal Reserve Chairman Jerome Powell surprised markets with an aggressive pivot to speed up the timeline for winding down their asset purchase program and begin hiking the Federal Funds rate. Since then, the markets have substantially repriced expectations for rate hikes from the Fed this year; projections have risen from a few 25 basis point (0.25%) increases to as high as 7-9 increases with an initial 50 basis point hike in March. The primary argument for the 50 basis point hike was that the Fed was woefully behind the curve in raising rates to help mitigate surging inflation. As shown below, the probability of a 50 basis point move at its March meeting has bounced around but remained firmly above 50% odds for all of February. However, the added geopolitical risks from the Russian invasion of Ukraine had many calling for the Fed to be less hawkish at the March meeting. But all the speculation ended abruptly as this writing was readying for publication. On March 2, Fed chair Powell told lawmakers he will propose a 0.25% interest rate increase at the central bank’s meeting in mid-March. Bond yields and stocks surged on the news.
Likelihood of a 50 bps Hike at the March FOMC Meeting
Source: Bloomberg, J.P. Morgan Asset Management.
Seasonal Concepts.
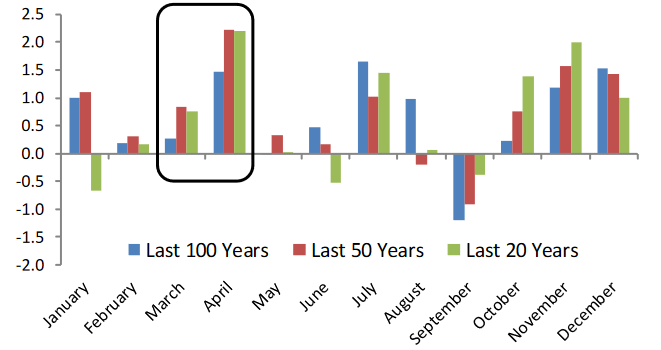
Clearly, January and February have been undesirable months for investors. But that isn’t exactly unusual historically, especially over the last 20 years. According to Bespoke Investment Group, the first two months of the year haven’t been as strong for stocks. But more favorable seasonality may be on the way as the calendar turns to March and April. The Dow Jones Industrial Average has averaged competitive returns in March relative to all other months, while April has been the single best month for stocks of the last 20 and 50 year periods. And the averages aren’t skewed by a few good returns, for the last 20 years March has been positive 65% of the time while April was up in 85% of the years, the best winning percentage for any month.
Average Monthly % Change for the Dow Jones Industrial Average
Source: Bespoke Investment Group.
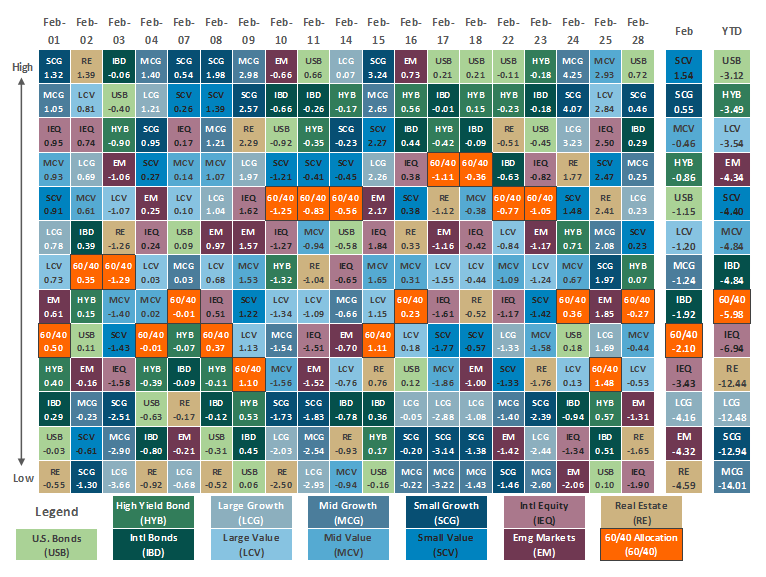
Asset Class Performance
The Importance of Diversification. Diversification mitigates the risk of relying on any single investment and offers a host of long-term benefits, such as lowering portfolio volatility, improving risk-adjusted returns, and helping investments to compound more effectively.
Source: Bloomberg. Asset‐class performance is presented by using market returns from an exchange‐traded fund (ETF) proxy that best represents its respective broad asset class. Returns shown are net of fund fees for and do not necessarily represent performance of specific mutual funds and/or exchange-traded funds recommended by The Retirement Planning Group. The performance of those funds may be substantially different than the performance of the broad asset classes and to proxy ETFs represented here. U.S. Bonds (iShares Core U.S. Aggregate Bond ETF); High‐Yield Bond (iShares iBoxx $ High Yield Corporate Bond ETF); Intl Bonds (SPDR® Bloomberg Barclays International Corporate Bond ETF); Large Growth (iShares Russell 1000 Growth ETF); Large Value (iShares Russell 1000 Value ETF); Mid Growth (iShares Russell Mid-Cap Growth ETF); Mid Value (iShares Russell Mid-Cap Value ETF); Small Growth (iShares Russell 2000 Growth ETF); Small Value (iShares Russell 2000 Value ETF); Intl Equity (iShares MSCI EAFE ETF); Emg Markets (iShares MSCI Emerging Markets ETF); and Real Estate (iShares U.S. Real Estate ETF). The return displayed as “Allocation” is a weighted average of the ETF proxies shown as represented by: 30% U.S. Bonds, 5% International Bonds, 5% High Yield Bonds, 10% Large Growth, 10% Large Value, 4% Mid Growth, 4% Mid Value, 2% Small Growth, 2% Small Value, 18% International Stock, 7% Emerging Markets, 3% Real Estate.
Chris Bouffard is CIO of The Retirement Planning Group (TRPG), a Registered Investment Adviser. He has oversight of investments for the advisory services offered through TRPG.
Disclaimer: Information provided is for educational purposes only and does not constitute investment, legal or tax advice. All examples are hypothetical and for illustrative purposes only. Past performance of any market results is no assurance of future performance. The information contained herein has been obtained from sources deemed reliable but is not guaranteed. Please contact TRPG for more complete information based on your personal circumstances and to obtain personal individual investment advice.

