Market Performance Summary
There just isn’t any way to sugarcoat it, January was a rough month for investors in all asset classes. After a year of solid gains across most major equity indices in 2021, January was a decidedly “risk-off” month in which pretty much everything dropped. Inflation, anxieties over central bank rate hikes and increase geopolitical all contributed to a sharp surge in volatility. Stocks and real estate were particularly hard hit, and had the biggest gains in 2021, but bonds also fell in response to the anticipation of more aggressive monetary policy.
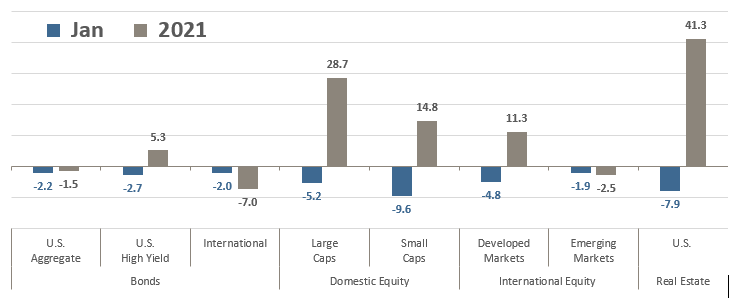
Asset Class Total Returns
Source: Bloomberg, as of January 31, 2022. Performance figures are index total returns: U.S. Bonds (Barclays U.S. Aggregate Bond TR), U.S. High Yield (Barclays U.S. HY 2% Issuer-Capped TR), International Bonds (Barclays Global Aggregate ex USD TR), Large Caps (S&P 500 TR), Small Caps (Russell 2000 TR), Developed Markets (MSCI EAFE NR USD), Emerging Markets (MSCI EM NR USD), Real Estate (FTSE NAREIT All Equity REITS TR).
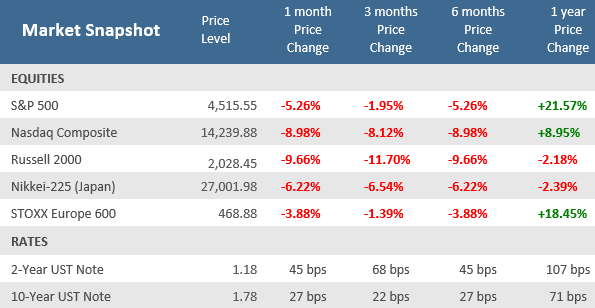
U.S. large cap stocks, as measured by the S&P 500, lost -5.2% on a total return basis (reinvesting dividends), but it was the smaller capitalization stocks that saw the worst damage in January. The small cap Russell 2000 Index lost -9.6% in January, wiping out much of 2021’s advance. Real Estate was the big winner in 2021 with a +41% total returns but suffered a -7.9% loss in January. Bonds were already grappling with concerns over rising inflation after the Federal Reserve’s pivot to a more aggressive stance on hiking rates and speeding up its tapering of monetary stimulus. As a result, U.S. bonds fell an additional -2.2% in January, after falling -1.5% in 2021, the first negative calendar year for U.S. bonds since 2013. It was similar for non-U.S. bonds, which dropped -2.0% in January, after losing -7.0% in 2021 when a stronger U.S. dollar and less accommodative foreign central banks were headwinds. The yield on the U.S. 10-year Treasury Note jumped 27 basis points (+0.27%) in January, the largest monthly gain since March 2021. But it was the short end of the yield curve that really saw the impact of investors bracing for a much more hawkish Fed. The yield on the U.S. 2-year Treasury Note surged 45 basis points (+0.45%) in January, the largest single month increase since December 2009. As discussed last month, the yield curve had already seen a significant flattening in 2021 (flattening occurs when yields on short-term bonds rise more than yields on long-term bonds). The spread between the yields of the 2-year and 10-year Treasury Notes is now only 0.6%, the narrowest it’s been since October 2020. A flattening yield curve is often a sign that the bond market is concerned about a potential Federal Reserve policy mistake or about economic growth slowing. Typically, it isn’t a recessionary concern until the yield curve inverts, meaning the 2-year yield is actually higher than the 10-year yield. It hasn’t done that for a sustained period since 2006-2007, although it briefly inverted for about a week in August 2019.
Source: Bloomberg.
Quick Takes
Strong Finish, Weak Month.
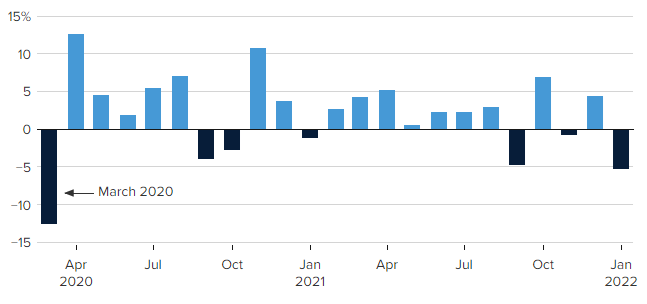
Despite a two-day relief rally to end the month, stocks experienced material declines in the month of January. The S&P 500 fell -5.3%, its worst month since March 2020 when it tumbled -12.5%. But the damage wasn’t limited to just the S&P 500. Market volatility spiked in anticipation of the Federal Reserve hiking interest rates this year, perhaps as early as March. Technology and high valuation stocks are pressured by higher rates and the technology-packed Nasdaq Composite Index sank -9.0% – also its worst month since March 2020 when it fell -10.1%. Higher rates make it harder for smaller companies to access the credit markets and service their debts. That was seen in the Russell 2000 small-cap index, which fell -9.7% in January, its worst month since plunging -21.9% in – you guessed it – March 2020.
A January to Forget, part 1) Stocks had their worst month since March 2020
S&P 500 Monthly Performance
Source: FactSet, CNBC.
A January Doesn’t Make a Year.
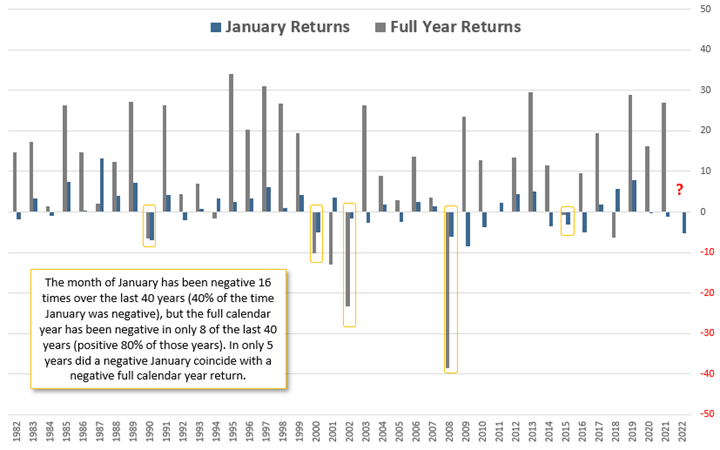
The S&P 500’s -5.3% return in January was the worst January performance since the index lost -8.6% in January 2009. However, beginning the year with a negative month does not necessarily presage a negative year. Over the last 40 years (1982-2021), the month of January has been negative 16 times, i.e. January was negative in 40% of those years. However, the full calendar year return for the S&P 500 was positive in all but 8 of those years, i.e. 80% of the last 40 years the index had a positive return. There were only 5 instances when January and the full calendar year were both negative and four of those years overlapped or were adjacent to a year during a recession (all four of those occurred before 2009).
A January to Forget, part 2) Stocks had their worst January since 2009
S&P 500 January Performance and Corresponding Calendar Year Performance
Source: Bloomberg, The Retirement Planning Group.
Here and There, Central Banks Scramble to Lift Rates.
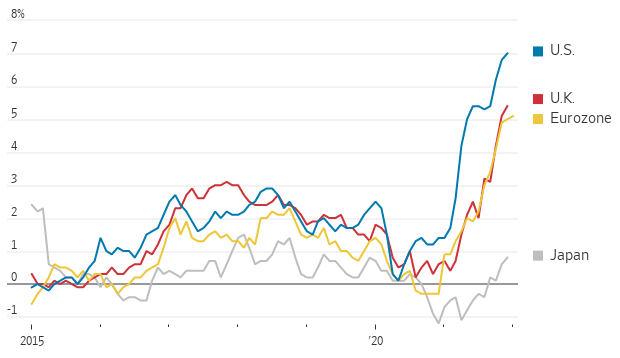
Much of the attribution for the volatility in the markets is the Federal Reserve’s much more aggressive plan to address surging inflation. But inflation, and central banks taking action to address it, is not a uniquely U.S. experience. As the Wall Street Journal points out, Europe’s central banks signaled growing concern about rising inflation and have indicated that monetary policy action will be needed in the form of higher interest rates and tighter financial conditions. The Bank of England raised its primary interest rate for the second consecutive meeting and said it will begin reducing its bond holding (like what the Fed plans with its bond purchase tapering). Brazil recently raised its benchmark interest rate, the Bank of Canada said it will raise rates soon, and Australia has ended its bond-buying program. The Bank of Japan is conspicuously absent in signaling any quantitative tightening but also is not yet facing the same degree of inflation levels as the U.S. and Europe, as shown in the chart below.
Central Banks Scramble to Fight Inflation
Consumer Prices, 12-month change
Source: U.S. Labor Department, Eurostat, U.K. Office for National Statistics of Japan, The Wall Street Journal.
Did the January Selloff Mark the End of the Pandemic?
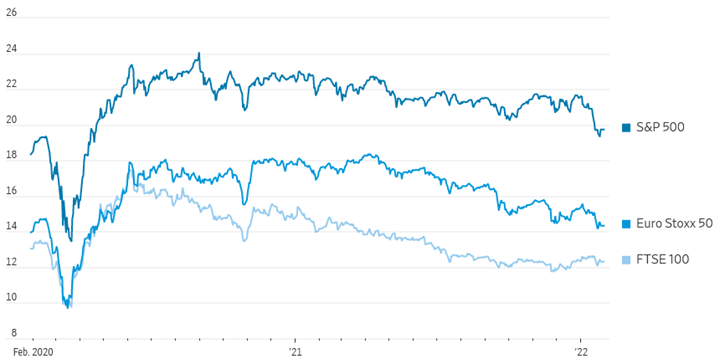
It never feels good when stock markets fall, but there is a silver lining: relative to the earnings that companies are expected to report over the next 12 months, stocks have been discounted to roughly where they were in February 2020, before the pandemic began in earnest. Small capitalization stocks are at their cheapest in two decades. More good news: the fuel doesn’t seem to be running out with this earnings season. At the time of this writing about half of the S&P 500 companies have already reported their earnings for the fourth quarter of 2021 and are beating earnings and sales estimates at a higher-than-normal rate. According to analysis by Bespoke Investment Group, companies aren’t getting credit the above average earnings reports, with the average stock falling -1.2% on its earnings day. That’s reflective of the old Wall Street quip that says the stock market is the only market people run away from when things go on sale.
Stocks Get Discounted
Price-to-Earnings Ratio
Source: FactSet, The Wall Street Journal. Note: Based on 12-month forward earnings expectations.
Is it time to make lemonade out of lemons?
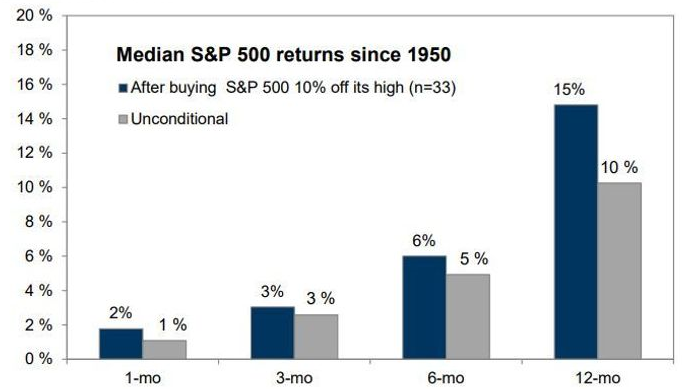
In the same vein as the discounted earnings following a market selloff, data from Goldman Sachs Investment Strategist David Kostin shows that past S&P 500 corrections have typically been good buying opportunities. In our January post Markets Rattled by Surging Inflation and Rising Rates we discuss how market corrections are not uncommon and selloffs of -10% or more have historically happened about once a year. The biggest drawdown in 2021 was just -5.2%, which is atypical. Goldman’s research has some good news. Of the 33 corrections of -10% or worse since 1950, the average duration was only about 5 months and an investor buying the index 10% below its all-time high would’ve have gained a median return of +15% over the next 12 months. The key in that data was whether the economy entered a recession because historically corrections rarely turned into bear markets (considered to be declines of -20% or worse) unless the economy was heading into a recession. Importantly, the U.S. economy is at / near full employment, earnings growth is still solid and positive, economic activity is still at expansionary levels, the housing market is still robust, and leading economic indicators are still positive, making the likelihood of a recession in the near future low.
Past S&P 500 Corrections Have Typically Been Buying Opportunities
Median S&P 500 Returns Since 1950, as of January 27, 2022
Source: Goldman Sachs Global Investment Research, MarketWatch.
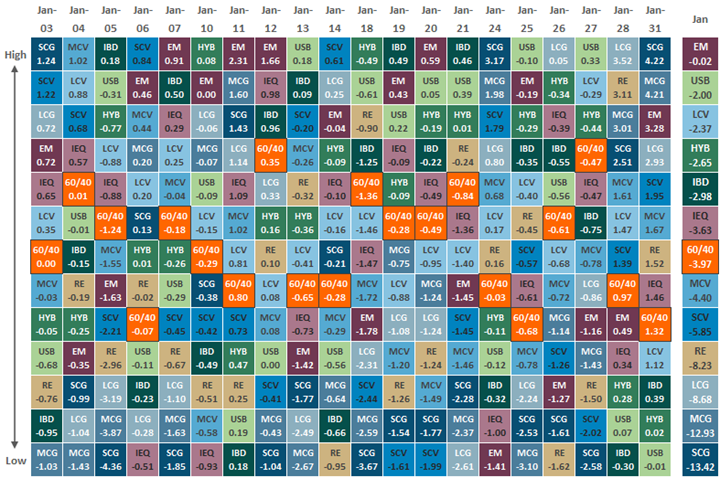
Asset Class Performance
The Importance of Diversification. Diversification mitigates the risk of relying on any single investment and offers a host of long-term benefits, such as lowering portfolio volatility, improving risk-adjusted returns, and helping investments to compound more effectively.
Source: Bloomberg. Asset‐class performance is presented by using market returns from an exchange‐traded fund (ETF) proxy that best represents its respective broad asset class. Returns shown are net of fund fees for and do not necessarily represent performance of specific mutual funds and/or exchange-traded funds recommended by The Retirement Planning Group. The performance of those funds may be substantially different than the performance of the broad asset classes and to proxy ETFs represented here. U.S. Bonds (iShares Core U.S. Aggregate Bond ETF); High‐Yield Bond (iShares iBoxx $ High Yield Corporate Bond ETF); Intl Bonds (SPDR® Bloomberg Barclays International Corporate Bond ETF); Large Growth (iShares Russell 1000 Growth ETF); Large Value (iShares Russell 1000 Value ETF); Mid Growth (iShares Russell Mid-Cap Growth ETF); Mid Value (iShares Russell Mid-Cap Value ETF); Small Growth (iShares Russell 2000 Growth ETF); Small Value (iShares Russell 2000 Value ETF); Intl Equity (iShares MSCI EAFE ETF); Emg Markets (iShares MSCI Emerging Markets ETF); and Real Estate (iShares U.S. Real Estate ETF). The return displayed as “Allocation” is a weighted average of the ETF proxies shown as represented by: 30% U.S. Bonds, 5% International Bonds, 5% High Yield Bonds, 10% Large Growth, 10% Large Value, 4% Mid Growth, 4% Mid Value, 2% Small Growth, 2% Small Value, 18% International Stock, 7% Emerging Markets, 3% Real Estate.
Chris Bouffard is CIO of The Retirement Planning Group (TRPG), a Registered Investment Adviser. He has oversight of investments for the advisory services offered through TRPG.
Disclaimer: Information provided is for educational purposes only and does not constitute investment, legal or tax advice. All examples are hypothetical and for illustrative purposes only. Past performance of any market results is no assurance of future performance. The information contained herein has been obtained from sources deemed reliable but is not guaranteed. Please contact TRPG for more complete information based on your personal circumstances and to obtain personal individual investment advice.

