Market Performance Summary
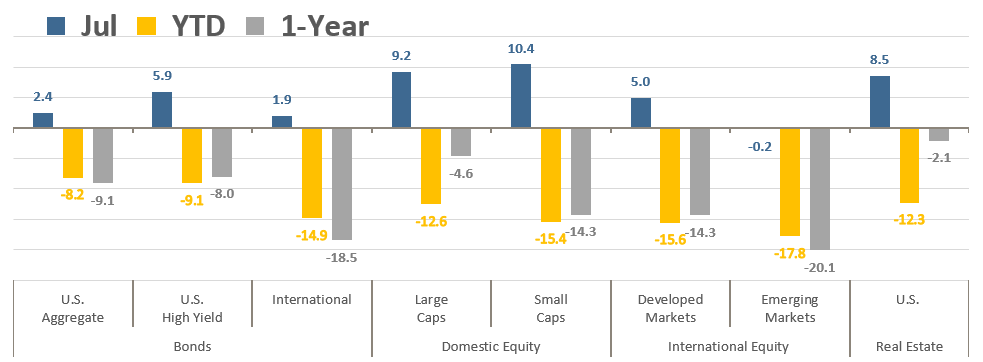
July tends to be the peak month for summer vacations and for investors it also brought a vacation from volatility as most major asset classes saw their biggest rallies of 2022. After the worst first half in decades for most asset classes, they are all still in negative territory for 2022, but the gains for U.S. stocks and bonds in July more than offset the declines in June and helped mitigate the year-to-date losses. July’s performance was a stark contrast from the previous six months when the S&P 500 tumbled to June bear market levels and the Bloomberg Aggregate Bond Index had its worst start to a year in history. The market’s reversal came as investors shrugged off the Federal Reserve’s aggressive stance on interest rate hikes and began to contemplate the idea that inflation may have peaked. Better-than-expected corporate earnings for the second quarter have also supported the case for more optimism.
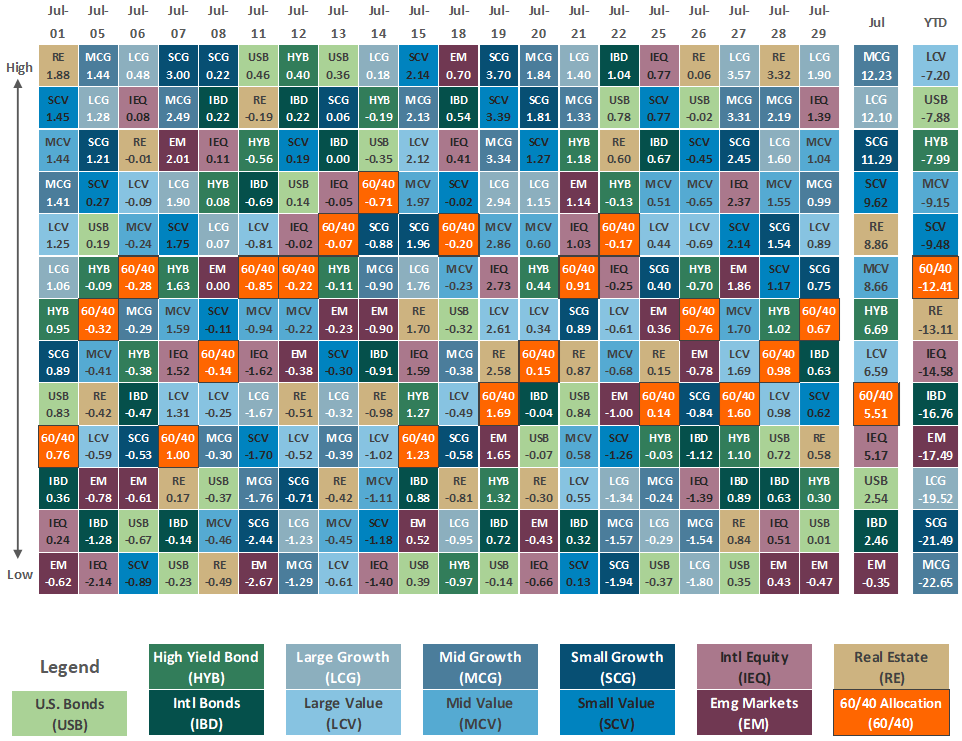
Asset Class Total Returns
Source: Bloomberg, as of July 31, 2022. Performance figures are index total returns: U.S. Bonds (Barclays U.S. Aggregate Bond TR), U.S. High Yield (Barclays U.S. HY 2% Issuer-Capped TR), International Bonds (Barclays Global Aggregate ex USD TR), Large Caps (S&P 500 TR), Small Caps (Russell 2000 TR), Developed Markets (MSCI EAFE NR USD), Emerging Markets (MSCI EM NR USD), Real Estate (FTSE NAREIT All Equity REITS TR).
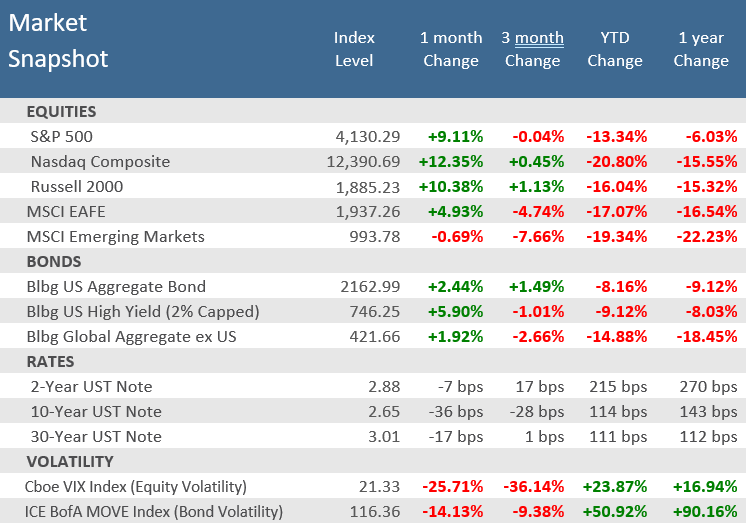
For U.S. large and small capitalization stocks July was the best monthly performance since November 2020. The S&P 500 Index jumped +9.2%, while the Russell 2000 Index was up double digits, gaining +10.4%. The more growth-oriented Nasdaq Composite Index did even better, surging +12.4% in July, its best month since April 2020. Real Estate also had solid gains, rising +8.5%. Overseas equities also saw healthy gains, though lower than those stateside. Developed market non-U.S. stocks gained +5.0%. The lone losing asset class in July was Emerging Markets, albeit just barely negative, slipping just -0.2%. The biggest detractor there was China, the largest weight in most emerging market passive indices. The MSCI China Index sank -9.3% in July as concerns about on-and-off COVID lockdowns dragged down growth prospects and the property market saw further deterioration (that sector was down -19.9% in July). The strong US dollar, which is near its highest levels of the past 20 years, is also a particularly big headwind for emerging markets. Inflation is surging in many emerging markets, and the combination of a weaker currency relative to the U.S. dollar not only exacerbates a country’s inflation, but it also diminishes the returns of assets denominated in that currency.
It wasn’t just stocks that had a good month. The yield on the benchmark U.S. 10-year Treasury note ended July at 2.65%, down from 3.01% at the end of June, propelling virtually all bond sectors higher (yields move in the opposite direction of bond prices). The riskier the bond, both in terms of longer duration and higher credit risk, the better the performance in July. The Bloomberg Aggregate Bond Index was up +2.4% while riskier high yield bonds were up nearly +6%. Even non-U.S. bonds managed to advance in July, gaining +1.9%, just their second positive month in the last twelve.
Source: Bloomberg.
Price Returns for Equity, Total Returns for Bonds.
Quick Takes
That ’70s Show.
Last month this space featured the prevalence of dire headlines plastered everywhere following “the worst first half to start the year since 1970.” And there was no denying that it was a terrible six months, but we also pointed out that the first half of a calendar has no special significance to markets and the economy, and even less to investors’ long-term financial plans. For good measure, here is that discussion again:
…there is no magical meaning to the first half of a calendar year. After all, why should that be any more significant than any other six-month period? The S&P 500 has fallen -20% or more in 13 other six-month periods since 1957, or about every 5 years on average. That’s never fun, but it isn’t uncommon and alarming as the headlines would indicate. Actually, seven of the eight worst 6-month drops have occurred in the 20 years from 2002 through 2021, so about every 3 years on average. And yet, over that 20-year period, the S&P 500 returned a total gain of +516% (including dividends), or an annual average of +9.5%. According to Bloomberg, the annual average total return for the S&P 500 from 1928 to 2021 was… +9.7%, or about the same as the 20-year period with all those bad 6-month periods.
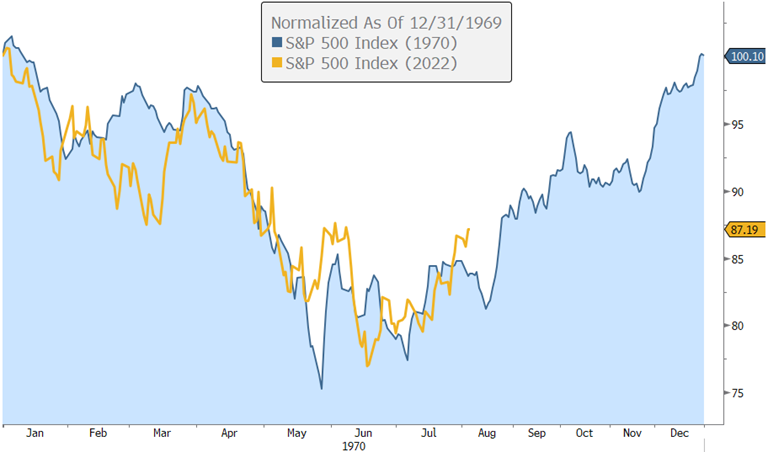
We also pointed out that historical evidence shows that there has been little to no correlation between the index’s performance in the first and second half of the year. And continuing the parallel to the “worst first half since 1970” theme, we cited that after stocks fell hard in the first half of 1970, in the second half rebounded even higher and finished the year positive. Given all the similarities between 2022 and 1970 beyond just the stock price action—both were midterm election years, both were periods of surging inflation, both had two recent successive quarters of negative GDP, and they each were periods of geopolitical turmoil/war—and the uncanny similarity in the stock market, we’re including the same chart again, updated through August 4th. There’s a well-known expression often quoted by investors, “history does not repeat itself, but it often rhymes.” The 2022 and 1970 parallels certainly seem to reflect that old adage.
Remember 1970?
The S&P 500 fell in the first half, but rebounded in the second half
Source: Bloomberg. Data for 2022 through August 4.
Hot, Hot, Hot.
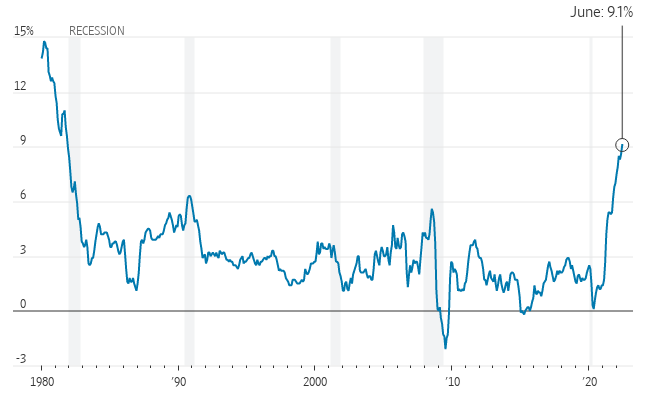
It wasn’t just the temperatures rising this summer, inflation data continued to climb as well. June consumer price inflation came in hotter than expected with the headline Consumer Price Index (CPI) rising to +9.1% year-over-year, well above expectations for +8.8%, and a fresh 41-year high. A big jump in gasoline prices—up +11.2% from the previous month and nearly +60% from a year earlier—drove much of the increase, while shelter and food prices were also major contributors. Among the few major component indexes to decline in June were lodging away from home and airline fares.
U.S. Consumer Inflation at 41-year High
Consumer Price Index (CPI), 12-month change
Fed Lifts Rates by 0.75 Point, Again.
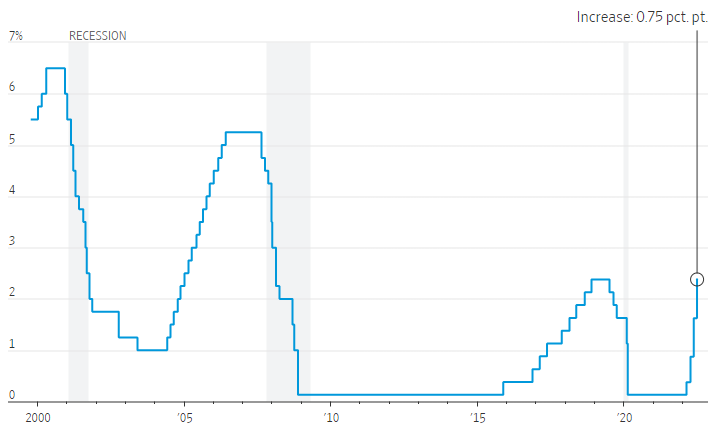
The Federal Reserve continued its rapid reverse of easy-money policies with another unusually large interest rate increase at its July 27th Federal Open Market Committee (FOMC) meeting. With inflation running at a four-decade high, Fed Chairman Jerome Powell indicated that more large increases could be coming. However, Powell did acknowledge that the slowdown in economic growth during the second quarter was notable, citing signs of cooling consumer spending, hiring, and housing activity. Yet it was too soon to say whether the Fed would dial down the size of its rate increases to a half-percentage point or a quarter-percentage point at its next meeting in September (there is no meeting in August). Powell said that at some stage, it would be appropriate to slow the pace of rate increases to assess their cumulative impact on the economy. “These rate hikes have been large, and they’ve come quickly,” he said, referring to the Fed’s four consecutive rate increases since March. “And it’s likely that their full effect has not been felt by the economy, so there’s probably some significant additional tightening in the pipeline.” With hints of an eventual slowdown for rate increases, markets rallied after the meeting and furthered the big July market rebound.
Fed Raises Rates by 0.75 Percentage Point Again
Federal-funds target rate
Note: Chart shows midpoint of range since 2008.
Source: Federal Reserve, The Wall Street Journal.
Has inflation peaked?
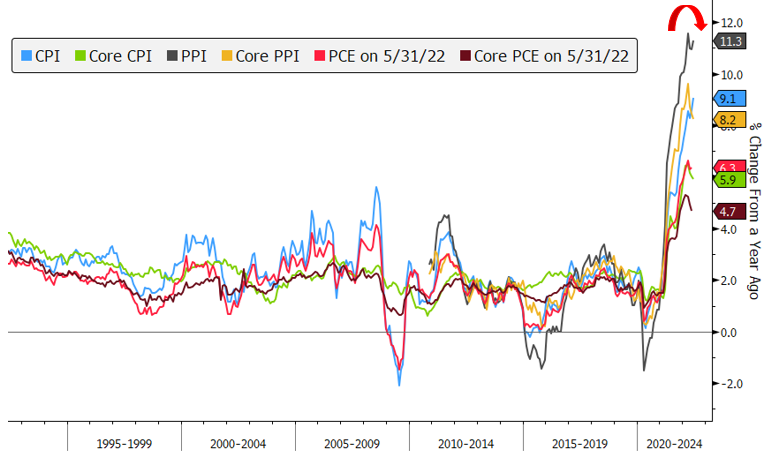
There are promising signs that the June four-decade high in consumer inflation might be a cycle high. Several other inflation gauges have all turned down from their recent highs. In fact, the Core CPI index, which strips the more volatile energy and food components out of the headline CPI, actually was down in June from the prior year. Producer Price Inflation (PPI) and Core PPI, again with energy and food removed, have both rolled over from their recent decades-long highs. The Personal Consumption Expenditure (PCE) and Core PCE, which is the Fed’s preferred gauge of inflation, are also off their recent highs. More recently in the July release of the ISM Purchase Managers Index (PMI), the average of the Prices Paid component for both the services and manufacturing sectors was at its lowest level since late 2020.
Inflation May Have Peaked
Key inflation gauges have rolled over
Source: Bloomberg.
Jumpin’ Jack Flash, It’s A Gas.
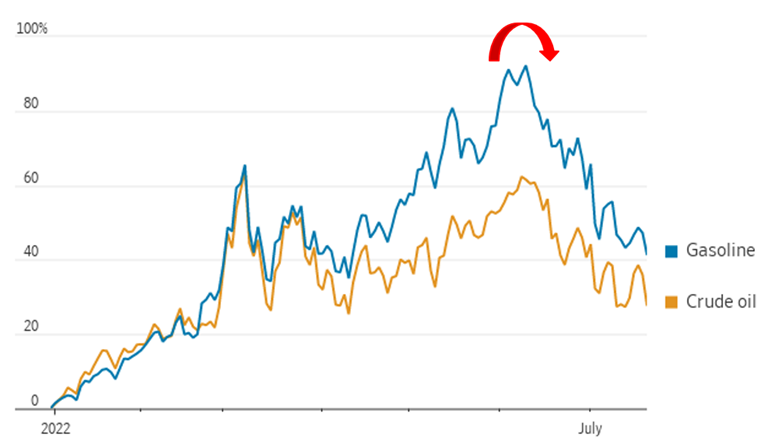
Why not stick with the ‘70s theme? In 1972 the Rolling Stones released the song Jumpin’ Jack Flash which included the lyrics “But it’s all right now, in fact, it’s a gas”. Well as mentioned above, June CPI was driven by a +60% year-over-year increase in the price of gas. Fortunately, as of August 4th, gasoline prices have declined for 51 days. According to AAA, the average cost of a gallon of regular unleaded gasoline fell to $4.14, off -17% from the peak of $5.02 on June 14th. Likewise, Brent crude, the global oil benchmark, has lost -7% this week and U.S. crude prices are down -7.7%. As of this writing, U.S. crude futures fell below $90 a barrel for the first time since February, the month Russia invaded Ukraine. Energy comprises about 8% of the CPI and tends to lead the process of inflation peaking, so the slump in oil and gasoline prices will help considerably to alleviate inflation pressures.
Gas Prices Have Eased Alongside the Broader Energy Market
Oil and gas prices have rolled over
Source: Factset, The Wall Street Journal. Data as of July 21, 2022.
Gas isn’t the only thing falling fast.
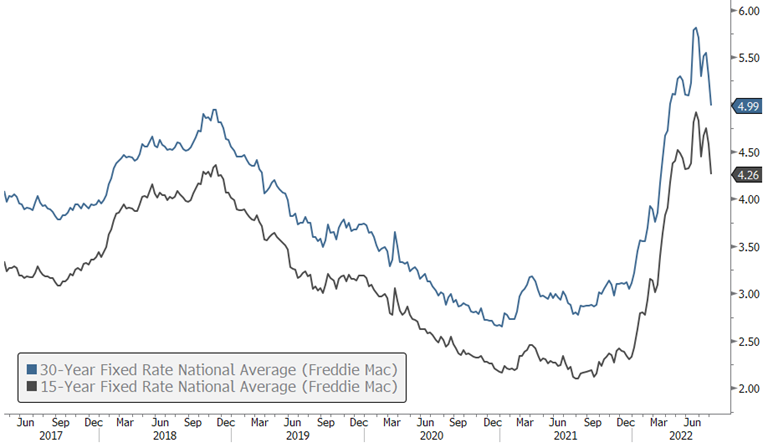
Mortgage rates have fallen sharply, dropping below 5% for the first time in four months. The rate on the 30-year fixed mortgage slipped to 4.99% on August 4th, from 5.3% the week prior, according to Freddie Mac, sinking below the 5% level for the first time since the week of April 7th. While the rate is lower than the 5.81% seen on June 23rd, it’s still more than 1.75 percentage points higher than the start of 2022. Mortgage demand has faltered in recent weeks after mortgage rates neared 6% in June and the median home price hit a record of $450.000, +16.6% above the prior June. It will take some time to see if the market is in a new range and rates will settle where they are now, but it’s yet another point of relief from the inflation pressures in the first half of the year.
U.S. Mortgage Rates Fall Below 5%
30-Year Fixed Rate Mortgage Average in the United States
Source: Freddie Mac, Bloomberg. Data as of August 4, 2022.
Taste Great! Less Filling!
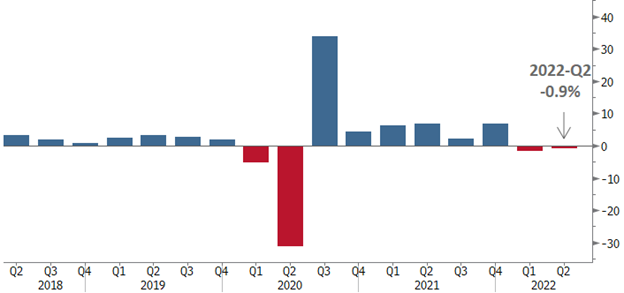
OK, this will be the last play on the ‘70s theme, promise! In the 1970s the Miller Brewing company was trying to get a foothold in the low-calorie beer market and began their iconic, decades-long campaign that featured athletes debating the “Great Taste” versus “Less Filling” virtues of Miller Lite. It may not be as memorable as the Miller ad campaign, but a real debate has broken out about whether the U.S. economy is in recession or not. At the end of July, the first look (of three) at 2022-Q2 Gross Domestic Product (GDP), the broadest measure of economic output, showed that the U.S. economy contracted quarter-over-quarter at a -0.9% annualized rate. It was the second consecutive negative quarter of GDP after the -1.6% decrease in Q1, marking a long-held and widely accepted technical rule for a recession. However, the official arbiter for defining recessions is the National Bureau of Economic Research (NBER), but they likely won’t decide for months, if not longer. Many contend that the factors the NBER watches, which are a broader array than GDP, don’t show the U.S. economy is in recession. Things like durable goods orders hitting all-time highs, near record-low unemployment, and travel companies beating earnings and raising guidance don’t happen during a recession. Regardless of whether the U.S. economy is in recession or not, the GDP results leave little debate that the economic environment has slowed considerably.
U.S. Economy Contracts for Second-Straight Quarter
Quarterly change in U.S. Gross Domestic Product (GDP)
Note: Seasonally adjusted at annual rates.
Source: Bureau of Economic Analysis, Bloomberg
Looking Forward.
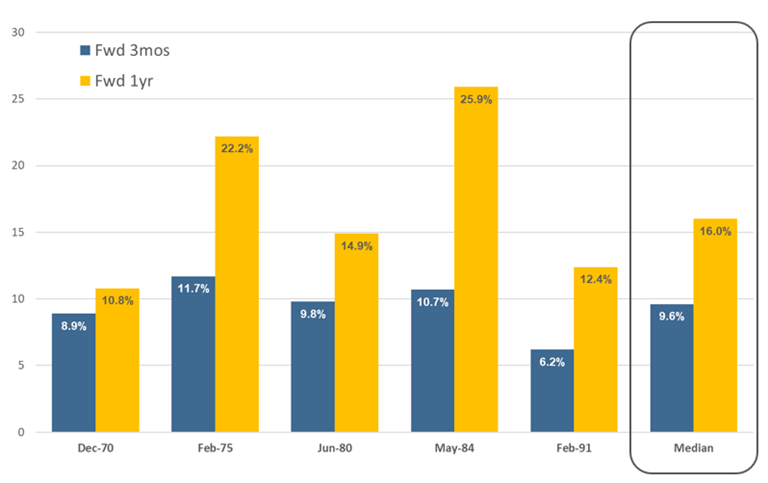
The chart below looks at what has historically happened to the market after inflation peaks. It looks at the high inflation periods of 1970, 1975, 1980, 1984, and 1991. The blue bars represent the S&P 500 return three months after the peak in inflation, and the yellow bars represent the 12-month return following inflation peaks. What is plainly evident is that after inflation peaks, markets have recovered with solid returns. Using these examples, the average three-month subsequent return was nearly +10% and the 1-year average return was +16%.
Stocks are Usually Positive After Inflation Peaks
S&P 500 Forward Return After Inflation Peaks (since 1958)
Source: Bloomberg, 22V Research.
Asset Class Performance
The Importance of Diversification. Diversification mitigates the risk of relying on any single investment and offers a host of long-term benefits, such as lowering portfolio volatility, improving risk-adjusted returns, and helping investments to compound more effectively.
Source: Bloomberg. Asset‐class performance is presented by using market returns from an exchange‐traded fund (ETF) proxy that best represents its respective broad asset class. Returns shown are net of fund fees for and do not necessarily represent performance of specific mutual funds and/or exchange-traded funds recommended by The Retirement Planning Group. The performance of those funds may be substantially different than the performance of the broad asset classes and to proxy ETFs represented here. U.S. Bonds (iShares Core U.S. Aggregate Bond ETF); High‐Yield Bond (iShares iBoxx $ High Yield Corporate Bond ETF); Intl Bonds (SPDR® Bloomberg Barclays International Corporate Bond ETF); Large Growth (iShares Russell 1000 Growth ETF); Large Value (iShares Russell 1000 Value ETF); Mid Growth (iShares Russell Mid-Cap Growth ETF); Mid Value (iShares Russell Mid-Cap Value ETF); Small Growth (iShares Russell 2000 Growth ETF); Small Value (iShares Russell 2000 Value ETF); Intl Equity (iShares MSCI EAFE ETF); Emg Markets (iShares MSCI Emerging Markets ETF); and Real Estate (iShares U.S. Real Estate ETF). The return displayed as “Allocation” is a weighted average of the ETF proxies shown as represented by: 30% U.S. Bonds, 5% International Bonds, 5% High Yield Bonds, 10% Large Growth, 10% Large Value, 4% Mid Growth, 4% Mid Value, 2% Small Growth, 2% Small Value, 18% International Stock, 7% Emerging Markets, 3% Real Estate.
Chris Bouffard is CIO of The Retirement Planning Group (TRPG), a Registered Investment Adviser. He has oversight of investments for the advisory services offered through TRPG.
Disclaimer: Information provided is for educational purposes only and does not constitute investment, legal or tax advice. All examples are hypothetical and for illustrative purposes only. Past performance of any market results is no assurance of future performance. The information contained herein has been obtained from sources deemed reliable but is not guaranteed. Please contact TRPG for more complete information based on your personal circumstances and to obtain personal individual investment advice.

