September Performance Summary
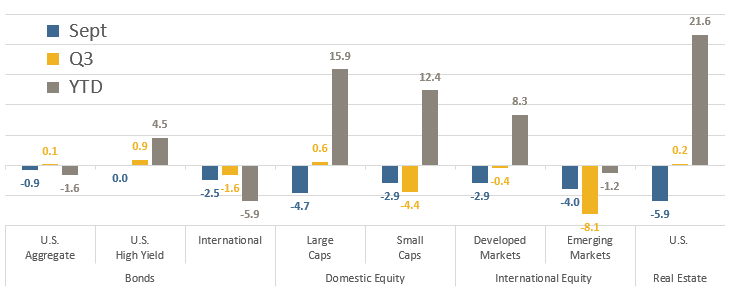
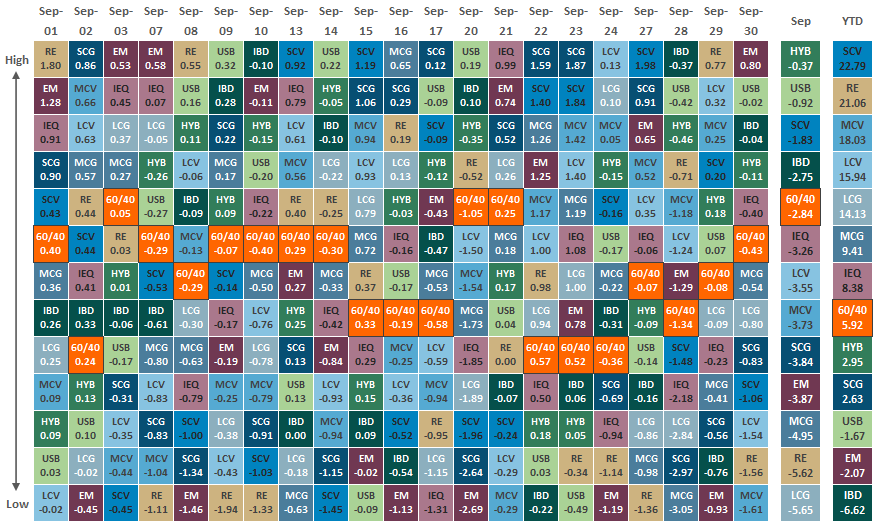
September has historically been a seasonally weak month for markets and 2021 was no exception. Virtually all major asset classes were negative for the month, something not seen since January. High Yield bonds performed the best but were essentially flat for the month. Real estate was down the most, falling nearly -6% in September, but is still up +21.6% in 2021 even after September’s plunge. Indeed, September looked like a profit-taking exercise as 4 of the 5 asset classes with the largest September declines also have the highest 2021 advances.
Source: Bloomberg, as of September 30, 2021. Performance figures are index total returns: U.S. Bonds (Barclays U.S. Aggregate Bond TR), U.S. High Yield (Barclays U.S. HY 2% Issuer-Capped TR), International Bonds (Barclays Global Aggregate ex USD TR), Large Caps (S&P 500 TR), Small Caps (Russell 2000 TR), Developed Markets (MSCI EAFE NR USD), Emerging Markets (MSCI EM NR USD), Real Estate (FTSE NAREIT All Equity REITS TR).
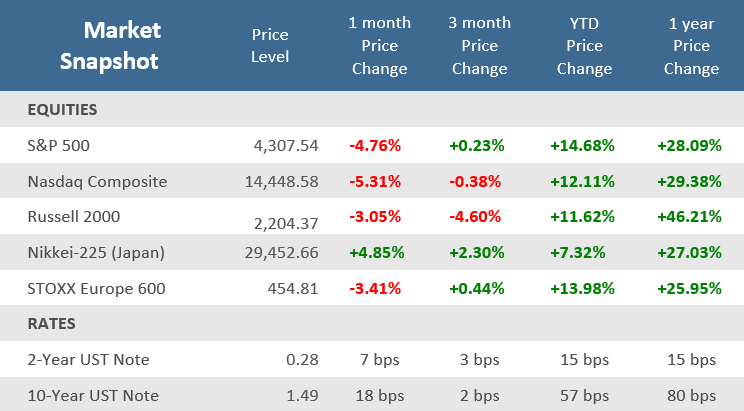
For the headline S&P 500 Index, it’s -4.7% decline was the worst monthly performance since March 2020 and it closed at its lowest level since July. Still the S&P is up +15.9% in 2021 on a total return basis. It’s a different story for the bond market though. Bonds haven’t been negative for a calendar year since 2013, but are at risk of it again for 2021. The year-to-date performance of the taxable bond market through 9/30/21 is a loss of -1.6% (as measured by the Bloomberg Barclays US Aggregate Bond Index). According to BTN Research, the worst year for the taxable bond market in the last 45 years (1976-2020) was a loss of -2.92% (total return) in 1994.
Source: Bloomberg.
Quick Takes
Seasonality Speedbump and Other September Stumbling Blocks.
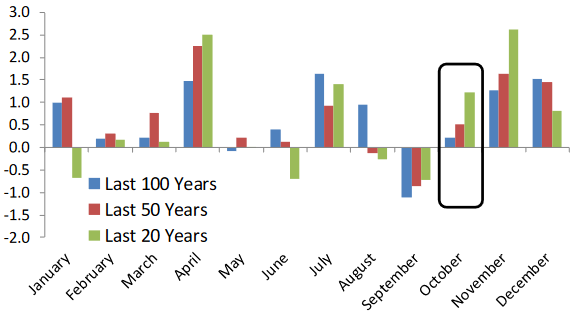
Stocks and bonds worldwide struggled in September, which is actually rather typical. According to Bespoke Investment Group, September is the only calendar month that the Dow Jones Industrial Average has averaged negative losses for the trailing 20-, 50- and 100-year periods. Aside from unfavorable seasonality, investors were spooked by weakness in the Chinese economy, global inflation, and interest rates rising, supply chain disruptions, the Fed tapering its asset purchases, and yet another instance of debt-ceiling drama.
Average Monthly % Change for the Dow Jones Industrial Average
September seasonality is poor but October to December is favorable
Source: Bespoke Investment Group.
Debt Ceiling Drama.
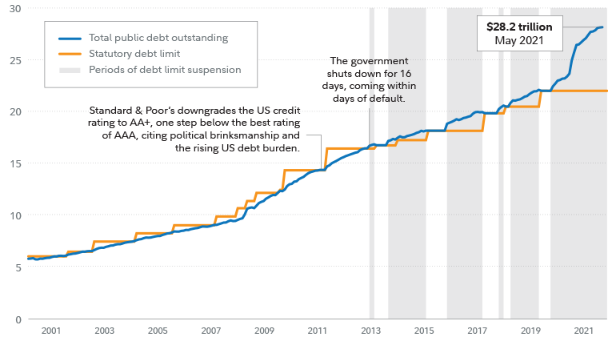
BTN Research points out that Congress has raised or extended our nation’s debt ceiling limit 78 times since 1960. The 78 total is split 49 times under a Republican president and 29 times under a Democratic president. Of course, it is happening again and markets are choppy in part because of the DC kabuki theatre and brinksmanship, but history suggests that the issue will likely be resolved—for the 79th time.
Suspending the Debt Limit Has Become a Common Solution
Federal debt, in trillions of dollars
Source: Congressional Research Service, Congressional Budget Office, and the Treasury Department, Fidelity Investments. Data as of 05/01/2021.
Transitory Tales.
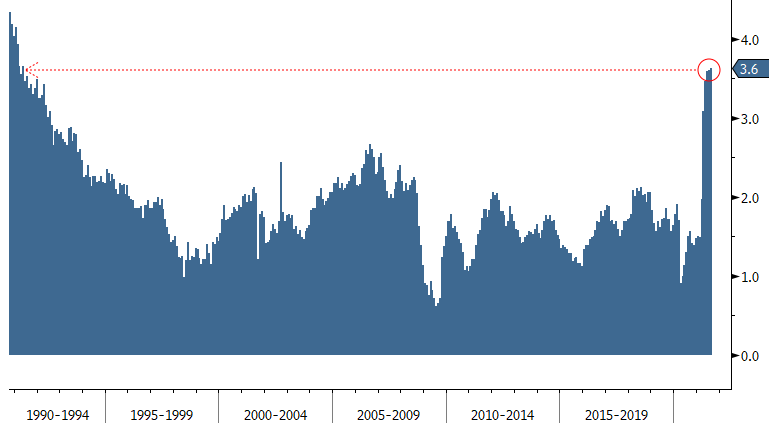
The Fed has been insisting that inflation was “transitory” but finally began to relent on that insistence in the face of mounting evidence that the prevalence, magnitude, and persistence of inflation pressures is greater than they expected. At its September meeting, the Federal Open Market Committee held benchmark fed rates near zero, as expected, but did signal that rate hikes could come sooner than anticipated. The Fed also indicated that it was ready to start reversing (i.e., taper) its pandemic stimulus programs in November.
The Core PCE Price Index (the Fed’s favored inflation measure)
The largest annual increase in 30 years
Source: Bloomberg.
Delta Delay.
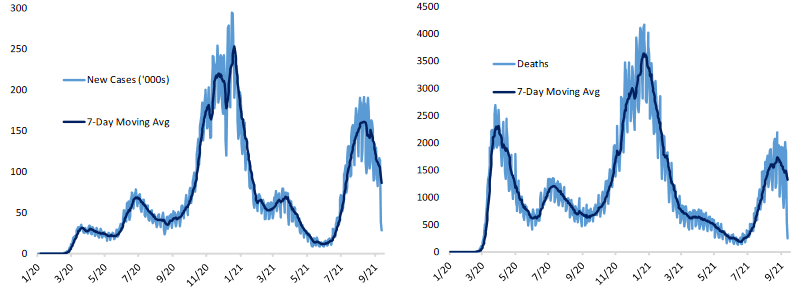
The Delta variant and supply chain problems have slowed the U.S. economic recovery. Many of the service sector metrics around restaurant, airport, and hotel activity that were rapidly accelerating May through mid-July really started to slow at the end of July and stalled through August and September. COVID cases pretty much around the world are down and since the early September peak, U.S. COVID hospitalizations are down -36%. Q3-2021 GDP will take a hit from the Delta-induced slowdown, but some of that delayed economic activity will likely be pushed into Q4-2021 GDP.
COVID-19 National Tracking Data
New Cases and Deaths, as of 10/3/2021
Source: Bespoke Investment Group.
Never Say Ever.
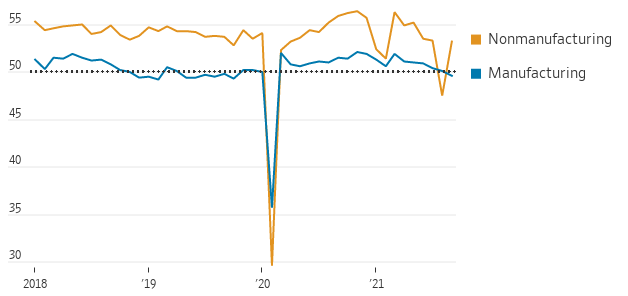
In March a massive supertanker named “Ever Given”, part of the Evergreen fleet, ran aground in the Suez Canal creating an enormous backlog of ships and caused market anxiety for the better part of two weeks. In September, heavily indebted Chinese property developer Evergrande sank markets on rumors it would miss its interest payments and default. It should be noted that the Evergrande situation has been brewing for months and was well know by professional market and macroeconomic watchers. The bigger issue is China’s efforts to deleverage overall which is pressuring Chinese growth. In fact, China’s manufacturing activity contracted in September, ending an 18-month expansion.
China’s Official Purchasing Managers Indexes (PMIs)
Readings above 50 indicate activity is expanding, below 50 contracting
Sources: Wind, National Bureau of Statistics, The Wall Street Journal.
Asset Class Performance
The Importance of Diversification. Diversification mitigates the risk of relying on any single investment and offers a host of long-term benefits, such as lowering portfolio volatility, improving risk-adjusted returns, and helping investments to compound more effectively.
Source: Bloomberg. Asset‐class performance is presented by using market returns from an exchange‐traded fund (ETF) proxy that best represents its respective broad asset class. Returns shown are net of fund fees for and do not necessarily represent the performance of specific mutual funds and/or exchange-traded funds recommended by The Retirement Planning Group. The performance of those funds may be substantially different than the performance of the broad asset classes and to proxy ETFs represented here. U.S. Bonds (iShares Core U.S. Aggregate Bond ETF); High‐Yield Bond (iShares iBoxx $ High Yield Corporate Bond ETF); Intl Bonds (SPDR® Bloomberg Barclays International Corporate Bond ETF); Large Growth (iShares Russell 1000 Growth ETF); Large Value (iShares Russell 1000 Value ETF); Mid Growth (iShares Russell Mid-Cap Growth ETF); Mid Value (iShares Russell Mid-Cap Value ETF); Small Growth (iShares Russell 2000 Growth ETF); Small Value (iShares Russell 2000 Value ETF); Intl Equity (iShares MSCI EAFE ETF); Emg Markets (iShares MSCI Emerging Markets ETF); and Real Estate (iShares U.S. Real Estate ETF). The return displayed as “Allocation” is a weighted average of the ETF proxies shown as represented by: 30% U.S. Bonds, 5% International Bonds, 5% High Yield Bonds, 10% Large Growth, 10% Large Value, 4% Mid Growth, 4% Mid Value, 2% Small Growth, 2% Small Value, 18% International Stock, 7% Emerging Markets, 3% Real Estate.
Chris Bouffard is CIO of The Retirement Planning Group (TRPG), a Registered Investment Adviser. He has oversight of investments for the advisory services offered through TRPG.
Disclaimer: Information provided is for educational purposes only and does not constitute investment, legal or tax advice. All examples are hypothetical and for illustrative purposes only. Past performance of any market results is no assurance of future performance. The information contained herein has been obtained from sources deemed reliable but is not guaranteed. Please contact TRPG for more complete information based on your personal circumstances and to obtain personal individual investment advice.

