Quick Takes
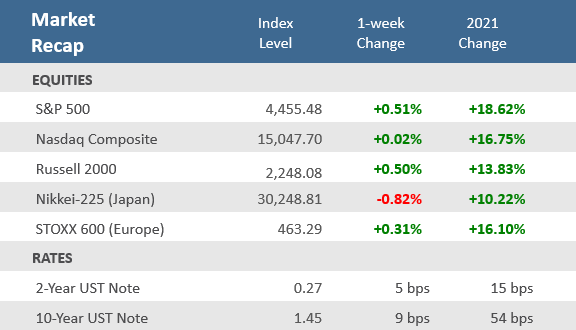
- The S&P 500 and Dow Jones were able to overcome a big loss on Monday to advance for the week. The CBOE Volatility Index (VIX) spiked to more than 28 on Monday before settling back under 18 by Friday.
- The yield on the U.S. 10-year Treasury rose 9 basis points, its largest weekly gain March 5. The Federal Reserve held benchmark interest rates near zero but said rate hikes could come sooner than expected.
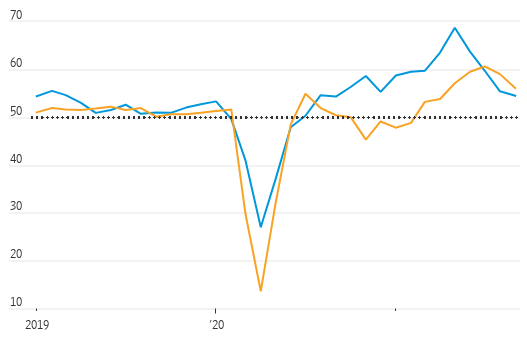
- According to Purchasing Manager Indices (PMIs) from forecasting firm IHS Markit, the pace of economic activity in the U.S. and Europe slowed again in September, yet still remains expansive.
Stocks gain after big selloff Monday
Global markets started the week in a big hole as most stock indices fell sharply Monday on fears of contagion spreading following the continued collapse of China’s second-largest property developer. Major U.S. equity indices fell more than -2.5% midday Monday, before recovering to limit losses to under -2% for the day. But stocks rallied throughout the week in choppy trading and the S&P 500 and Dow managed to eke out gains for the week of +0.5% and +0.6% respectively. The tech-heavy Nasdaq was essentially flat at +0.02%. It was a fairly quiet week for economic data, as detailed below, but the data releases ramp up in a big way next week as September comes to an end.
One of the more anticipated economic events of the week was the Federal Open Market Committee decision on interest rates. The Fed held benchmark fed rates near zero, as expected, but did signal that rate hikes could come sooner than anticipated. The Fed also indicated that it was ready to start reversing (i.e., taper) its pandemic stimulus programs in November. In Washington, the US House of Representatives passed a bill to suspend the debt limit and avoid a government shutdown, but it faces Senate roadblocks with the September 30 deadline fast approaching.
Chart of the Week
The pace of economic activity in the U.S. and Europe slowed again in September. Economic forecasting firm IHS Markit said its index measuring U.S. business activity fell to the lowest level in a year and its eurozone index dropped to a five-month low. Both regions are showing an economic soft patch, as supply-chain issues and concerns over the Delta variant weigh on businesses. Purchasing managers at both manufacturing and services businesses reported slower growth and cited price pressures tied to higher costs for supplies and labor. There were bright spots. A measure of optimism at U.S. services businesses reached a three-month high as purchasing managers anticipated a pickup in demand.
Economic Activity Softens A Bit
Composite Purchasing Managers Indexes (PMIs)
Source: IHS Markit, The Wall Street Journal.
Economic Review
Homebuilder sentiment rose in September as the NAHB Housing Market Index rebounded to 76 from a one-year low of 75 in August and beating expectations for 74.
Housing Starts rose +3.9% in August, above expectations of +1.0%. Building Permits were also stronger than expected, up +6% vs. expectations for a -1.8% decline.
Existing Home Sales unexpectedly declined by -2% in August from July, well below forecasts. Each of the four major U.S. regions experienced declines on both a month-over-month and a year-over-year perspective, breaking a two-month streak of increases.
New Home Sales data for August were solid, up +1.5% at an annualized sales pace of 740k versus 715k forecasted by economists. The median price of a new home was unchanged in August from July, at a record high of $390,900.
The Conference Board’s Leading Economic Index (LEI) rose +0.9% to 117.1 in August, better than the +0.7% forecast. Results were robust with 9 of the 10 components positive, a drop in consumer expectations was the only component to subtract from August’s gain.
Initial Jobless Claims unexpectedly rose for a 2nd straight week to 351,000, well above forecasts of 320,000. Continuing Claims rose by +180,000 to 2.845 million, worse than the 2.65 million expected.
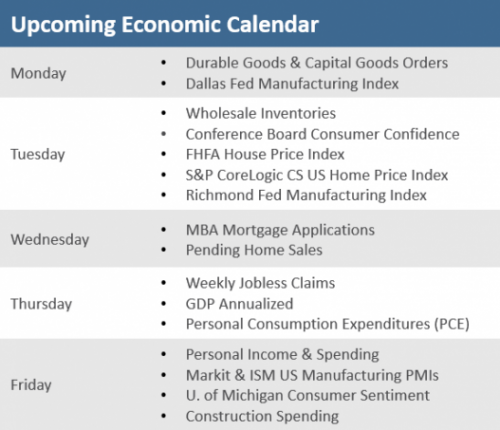
The Week Ahead
Aside from last-minute scrambling to prevent a government shutdown, important economic data being released this week include durable goods, consumer confidence, personal consumption, and the housing markets. To add to the busy economic calendar, there are several Federal Reserve members speaking during the week.
Did You Know?
AND HERE WE ARE AGAIN — Congress has raised or extended our nation’s debt ceiling limit 78 times since 1960, i.e., an average of once every 9 months. The 78 total is split 49 times under a Republican president and 29 times under a Democratic president (source: Treasury Department, BTN Research).
BAD DAYS — As of Friday 9/17/21, the S&P 500 has gone 223 trading days (just short of 11 months) without sustaining a 1-day loss of at least -3% (total return). At the start of the pandemic in February 2020, the index had daily losses of at least -3% 12 times over 28 trading days (source: BTN Research).
This Week in History
On this day in 1974, the field of behavioral finance was born, as Science, the journal of the American Association for the Advancement of Science, published “Judgment under Uncertainty: Heuristics and Biases.” This underwhelmingly titled article was the first major research paper to demonstrate that humans do not always make risky decisions rationally—a contention that is still disputed by mainstream economists (source: The Wall Street Journal).
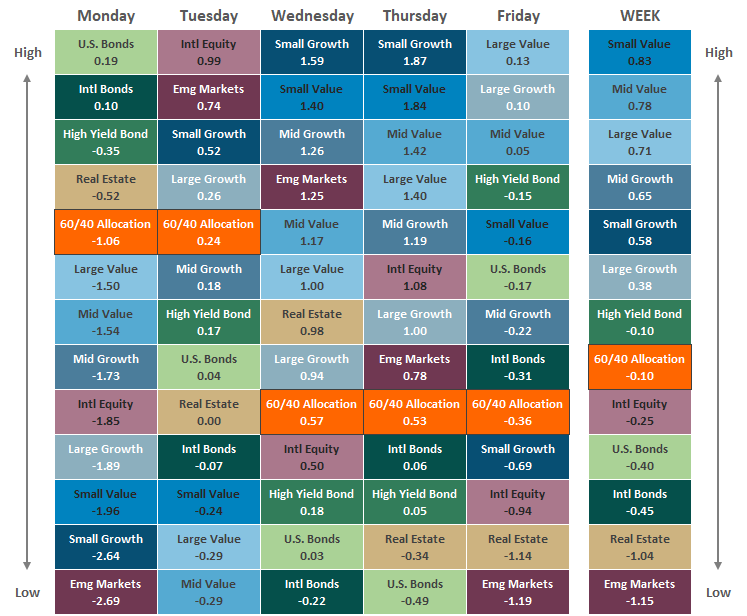
Asset Class Performance
The Importance of Diversification. Diversification mitigates the risk of relying on any single investment and offers a host of long-term benefits, such as lowering portfolio volatility, improving risk-adjusted returns, and helping investments to compound more effectively.
Source: Bloomberg. Asset‐class performance is presented by using market returns from an exchange‐traded fund (ETF) proxy that best represents its respective broad asset class. Returns shown are net of fund fees for and do not necessarily represent the performance of specific mutual funds and/or exchange-traded funds recommended by The Retirement Planning Group. The performance of those funds may be substantially different than the performance of the broad asset classes and to proxy ETFs represented here. U.S. Bonds (iShares Core U.S. Aggregate Bond ETF); High‐Yield Bond (iShares iBoxx $ High Yield Corporate Bond ETF); Intl Bonds (SPDR® Bloomberg Barclays International Corporate Bond ETF); Large Growth (iShares Russell 1000 Growth ETF); Large Value (iShares Russell 1000 Value ETF); Mid Growth (iShares Russell Mid-Cap Growth ETF); Mid Value (iShares Russell Mid-Cap Value ETF); Small Growth (iShares Russell 2000 Growth ETF); Small Value (iShares Russell 2000 Value ETF); Intl Equity (iShares MSCI EAFE ETF); Emg Markets (iShares MSCI Emerging Markets ETF); and Real Estate (iShares U.S. Real Estate ETF). The return displayed as “Allocation” is a weighted average of the ETF proxies shown as represented by: 30% U.S. Bonds, 5% International Bonds, 5% High Yield Bonds, 10% Large Growth, 10% Large Value, 4% Mid Growth, 4% Mid Value, 2% Small Growth, 2% Small Value, 18% International Stock, 7% Emerging Markets, 3% Real Estate.
Chris Bouffard is CIO of The Retirement Planning Group (TRPG), a Registered Investment Adviser. He has oversight of investments for the advisory services offered through TRPG.
Disclaimer: Information provided is for educational purposes only and does not constitute investment, legal or tax advice. All examples are hypothetical and for illustrative purposes only. Past performance of any market results is no assurance of future performance. The information contained herein has been obtained from sources deemed reliable but is not guaranteed. Please contact TRPG for more complete information based on your personal circumstances and to obtain personal individual investment advice.

