Quick Takes
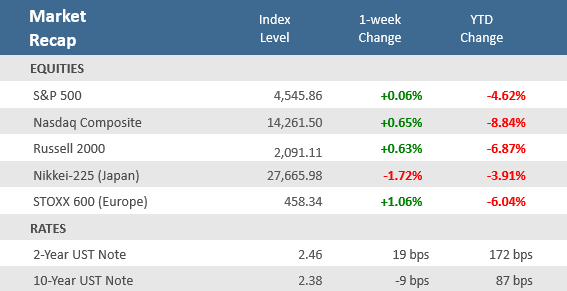
- The S&P 500 and Nasdaq closed higher to extend their consecutive weeks rally to three, the first three-week win streak since November 2021. Still mixed economic news and mixed news from the Russia-Ukraine hostilities made for yet another choppy week of trading.
- The Treasury yield curve continued to flatten as the closely watched 10-year / 2-year yield curve inverted for the first time since 2019 (meaning the yield on 2-year Treasury notes are now higher than those on 10-year Treasury notes).
- Economic data was mixed, with lower-than-expected GDP, ISM manufacturing, and construction spending. But consumer confidence surprised to the upside and the labor market continues to show strength with better-than-expected job openings, ADP payroll growth, and a lower-than-expected unemployment rate.
Stocks Extend Winning Streak, Yield Curve Extends Flattening Streak
After a two-week rally that was the best since 2020, stocks were a bit uninspiring this past week but were still able to eke out a small gain. The S&P 500 was barely positive with a +0.1% gain, and the Nasdaq gained 0.7%, which were enough to keep their winning streak alive at three weeks. It’s the first three-week winning streak since November 2021. Economic data was mixed throughout the week, but a solid March employment report on Friday helped push stock up for the week. But the decent jobs data also made it more likely that the Federal Reserve will have to stay aggressive with its path of monetary tightening to keep inflation in check.
As a result, the yield on the U.S. 10-year Treasury note fell to 2.38% from 2.47%, but the 2-year Treasury yield jumped up 19 basis points to 2.46% from the prior week, causing an inversion between the two (meaning the shorter-term note has a higher yield than the longer-term note). It was the first time since 2019 that the 10-year/2-year yield curve has inverted, which has sparked a lot of talk about recession. The 10-year and the 2-year curve is closely watched by financial media, and a negative yield spread has anticipated economic slowdown and recession in the past. But another part of the yield curve, the 10-year and three-month yields remain positive and rising; therefore, is not confirming the warning from the 10-year and 2-year curve. The 10-year/3-month yield curve is closely monitored by the Fed and has the longest track record, and success, of anticipating recessions—it has inverted prior to the last eight recessions going back to 1970. Again, it is positive and rising.
With a decent jobs report showing a tight labor market, consumer spending still robust, capital spending by companies expected to stay strong this year, and COVID increasingly becoming de-emphasized, there are still important tailwinds behind the U.S. economy. Markets continue to grapple with the war in Ukraine and on Saturday Ukrainian officials reported they had regained control of the capital city of Kyiv and the possibility of peace talks between Ukraine and Russia seemed to advance. It is far too early to put those in the tailwinds category, but it does appear to be an improvement in the hostilities.
Chart of the Week
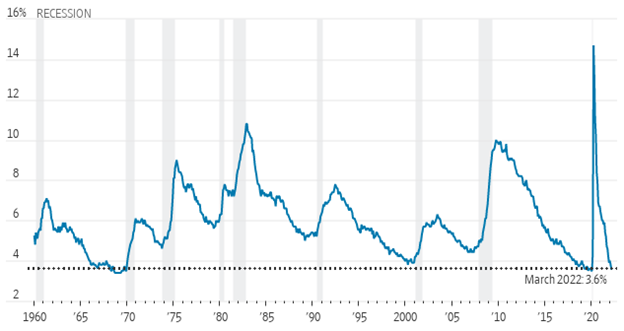
The March Nonfarm Payrolls Employment Report showed that although job growth missed expectations on the headline number, the underlying components were still solid. U.S. nonfarm payrolls rose by 431,000 in March, below Bloomberg’s consensus estimate of a 490,000 rise. But February payrolls were revised higher to a gain of 750,000 from the initial report of 678,000. The Bureau of Labor Statistics said the leisure and hospitality sectors led the gains, followed by professional and business services as well as retail trade. The Labor Force Participation Rate rose to 62.4% from February’s unrevised 62.3% figure, which was in line with expectations. The Unemployment Rate fell to 3.6% from 3.8%, exceeding expectations for a decline to 3.7%. That puts the unemployment rate only one-tenth of a percentage point from its pre-pandemic bottom of 3.5%, which was a 50-year low. The Underemployment Rate—including total unemployed and those employed part-time for economic reasons, along with people who are marginally attached to the labor force—declined to 6.9% from 7.2%. Average Hourly Earnings, a closely watched inflation metric, increased +0.4%, in line with expectations, and ahead of February’s upwardly-revised +0.1% rise. Compared to last year, pay was +5.6% higher, slightly ahead of forecasts of a +5.5% rise. Finally, Average Weekly Hours Worked, which figures into productivity, fell a bit to 34.6 from February’s unrevised 34.7, where it was expected to remain. All in all, the report shows a very healthy labor market and is likely to do little to ease concerns by Federal Reserve Chairman Jerome Powell that the labor market is overheating.
Unemployment is Almost Back to Pre-pandemic Lows
Unemployment rate
Note: Seasonally adjusted.
Source: Labor Department via St. Louis Fed, The Wall Street Journal.
Economic Review
- The final release (of three) of Q4-2021 Gross Domestic Product (GDP), the broadest measure of U.S. economic output, reported an annualized expansion rate of +6.9%, slightly below expectations for an unrevised +7.0% in the second release. Q3’s figure was unadjusted at a +2.3% increase. Personal Consumption Expenditures (PCE) were revised down to +2.5% from the previous estimate of +3.1%, which was expected to remain. The GDP Price Index was unrevised at +7.1%, matching estimates, and the Core PCE Index, which excludes food and energy, was also unadjusted at +5.0%, in line with expectations.
- The March ISM Manufacturing Purchasing Managers Index (PMI) reported manufacturing unexpectedly fell to 57.1 from 58.6 in February and missing expectations of 59.0 but was still at expansion levels (levels above 50). Both new orders and production slowed but continued to grow. Inflation pressures continued with prices paid jumping 11.5 points to 87.1.
- The final March S&P Global U.S. Manufacturing PMI Index was revised upward to 58.8, slightly beating expectations of 58.5 and above February’s 57.3. S&P Global said the report signaled a sharp improvement in operating conditions across the U.S. manufacturing sector.
- The March Dallas Fed Manufacturing Index declined to 8.7, far more than the expected 11.0 and the 14.0 in February but remained in expansion territory (levels above zero). New orders, shipments, and production all decelerated but remained above zero, while employment growth accelerated. Inflation persists as prices paid for raw materials accelerated above 70.
- Home-price growth accelerated as the supply of homes fell to a new low. The S&P CoreLogic Case-Shiller National Home Price Index, which measures average home prices in major metropolitan areas across the nation, rose +19.2% in the year that ended in January, up from an +18.9% annual gain the prior month. A separate gauge of home-price growth, the Federal Housing Finance Agency (FHFA) Home Price Index also released Tuesday reported an +18.2% increase in home prices in January from a year earlier.
- Construction Spending increased +0.5% in February, below expectations of +1.0% and January’s upwardly revised +1.6%. Residential spending was up +1.1%, while non-residential spending dipped -0.1%.
- The weekly MBA Mortgage Application Index declined -6.8% last week, following the prior week’s decrease of -8.1%, for the third-straight weekly decline. The Refinance Index fell -14.9% and more than offset a +0.6% gain for the Purchase Index. The average 30-year mortgage rate jumped +30 bps to 4.80% and is up 1.47% versus a year ago.
- The March Conference Board’s Consumer Confidence Index rose to 107.2 from February’s downwardly revised 105.7, slightly above expectations of 107.0. The overall index was dragged by the Expectations Index of business conditions for the next six months portion, which fell to 76.6 from February’s downwardly-revised 80.8 level, while the Present Situation Index portion of the survey climbed to 153.0 from the negatively revised 143.0 in February. On employment, the labor differential—consumers’ appraisal of jobs being “plentiful” minus being “hard to get”—increased to 47.4 from February’s 41.5.
- February Personal Income rose +0.5%, meeting expectations, and ahead January’s upwardly revised +0.1%. Personal Spending was up +0.2%, missing expectations of +0.5%, and well below the prior month’s upwardly revised +2.7% rise. The Savings Rate as a percentage of disposable income was 6.3%, above January’s 6.1% rate.
- Wards Auto estimates March Vehicle Sales of 13.33 million (Seasonally Adjusted Annual Rate), down -5.3% from February, and down -24.4% from March 2021. Sales decreased late last year due to supply issues, but it appears the “supply chain bottom” was in September 2021. Sales in February were below the expectations of 14.1 million and not far above the supply chain bottom last year.
- The February Job Openings and Labor Turnover Survey (JOLTS), a measure of unmet demand for labor, dropped to 11.26 million jobs available to be filled, down from an upwardly revised 11.28 in January, but above expectations for 11.00 million. The hiring rate increased to 4.4% compared to 4.3% in January and job separations increased to 4.1% from the prior month’s 4.0% while the quit rate rose to 2.9% from 2.8% in January.
- The March ADP Employment Change Report reported private sector payrolls rose by 455,000 jobs, beating estimates for a 450,000 gain. February’s increase of 475,000 jobs was revised higher to a 486,000 increase.
- Weekly unemployment claims unexpectedly rose by 14,000 to 202,000 versus estimates of 196,000 and the prior week’s upwardly revised 188,000. Continuing claims, a proxy for the total number of people on unemployment rolls through regular state programs, fell by 35,000 to 1,307,000, below estimates of 1,340,000.
The Week Ahead
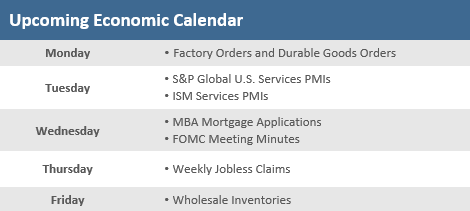
There is little on the economic calendar in the week ahead, and another couple weeks before the next earnings season really gets under way. With the lull in economic and earnings reports, investors will likely focus on Wednesday’s release of the Federal Reserve’s minutes from its March meeting, at which it raised rates for the first time since 2018. Fed speakers will be busy with eight scheduled speaking engagements between Tuesday and Thursday. Investors will be watching for nuances around the discussion on the size of future hikes to the target of the federal funds rate. Of course, any developments around the ongoing Russia-Ukraine conflict will also command attention.
Did You Know?
QUICKER THAN EXPECTED – The Fed meeting minutes from 3/17/2021 (a year ago) anticipated that the Fed would not implement interest rate hikes until at least 2023. Instead, the Fed raised short-term rates on 3/16/2022, indicating that it may implement additional rate hikes at each of the remaining 6 Fed meetings scheduled in 2022 (source: Federal Reserve, BTN Research).
BALANCED PORTFOLIO – As of 12/31/2021, the US stock market, comprising 4,266 public-traded companies on the NYSE, AMEX and NASDAQ exchanges, was worth $53.4 trillion. The US bond market (including treasury, municipal, corporate, mortgage and asset-backed debt) was worth $52.9 trillion. Treasury debt ($22.6 trillion) makes up the largest piece of the US bond market (source: Siblis Research, Securities Industry and Financial Markets Association, BTN Research).
EATING AT HOME – US grocery prices, i.e., “food at home,” increased by +8.6% over the year ending 2/28/2022. That compares to a +3.5% price increase for groceries for the year ending 2/28/2021 and a +0.8% price increase for the year ending 2/29/2020 (source: Bureau of Labor Statistics, BTN Research).
This Week in History
Let’s Make a Deal – On this day in 1867, U.S. Secretary of State William H. Seward agreed to purchase the Alaskan territories from Russia for $7 million—a price so preposterous that newspapers around the country immediately tagged the deal “Seward’s Folly” and christened Alaska “the polar bear garden” (source: The Wall Street Journal).
Asset Class Performance
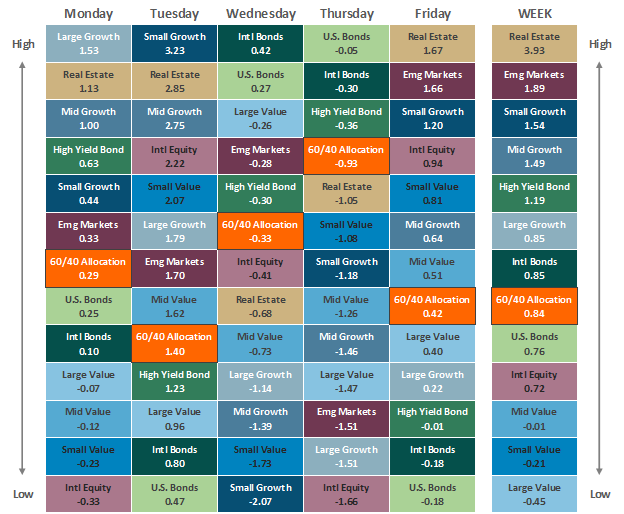
The Importance of Diversification. Diversification mitigates the risk of relying on any single investment and offers a host of long-term benefits, such as lowering portfolio volatility, improving risk-adjusted returns, and helping investments to compound more effectively.
Source: Bloomberg. Asset‐class performance is presented by using market returns from an exchange‐traded fund (ETF) proxy that best represents its respective broad asset class. Returns shown are net of fund fees for and do not necessarily represent the performance of specific mutual funds and/or exchange-traded funds recommended by The Retirement Planning Group. The performance of those funds may be substantially different than the performance of the broad asset classes and to proxy ETFs represented here. U.S. Bonds (iShares Core U.S. Aggregate Bond ETF); High‐Yield Bond (iShares iBoxx $ High Yield Corporate Bond ETF); Intl Bonds (SPDR® Bloomberg Barclays International Corporate Bond ETF); Large Growth (iShares Russell 1000 Growth ETF); Large Value (iShares Russell 1000 Value ETF); Mid Growth (iShares Russell Mid-Cap Growth ETF); Mid Value (iShares Russell Mid-Cap Value ETF); Small Growth (iShares Russell 2000 Growth ETF); Small Value (iShares Russell 2000 Value ETF); Intl Equity (iShares MSCI EAFE ETF); Emg Markets (iShares MSCI Emerging Markets ETF); and Real Estate (iShares U.S. Real Estate ETF). The return displayed as “Allocation” is a weighted average of the ETF proxies shown as represented by: 30% U.S. Bonds, 5% International Bonds, 5% High Yield Bonds, 10% Large Growth, 10% Large Value, 4% Mid Growth, 4% Mid Value, 2% Small Growth, 2% Small Value, 18% International Stock, 7% Emerging Markets, 3% Real Estate.
Chris Bouffard is CIO of The Retirement Planning Group (TRPG), a Registered Investment Adviser. He has oversight of investments for the advisory services offered through TRPG.
Disclaimer: Information provided is for educational purposes only and does not constitute investment, legal or tax advice. All examples are hypothetical and for illustrative purposes only. Past performance of any market results is no assurance of future performance. The information contained herein has been obtained from sources deemed reliable but is not guaranteed. Please contact TRPG for more complete information based on your personal circumstances and to obtain personal individual investment advice.


