Quick Takes
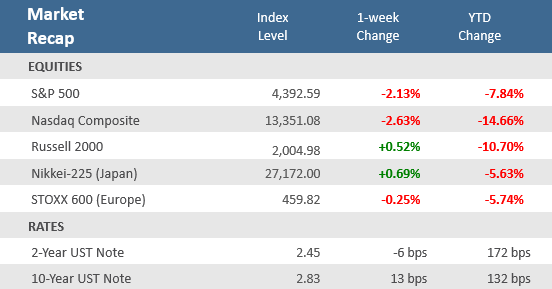
- The major U.S. stock indexes ended the week with losses, but small cap stocks managed to stay positive. A rotation to defensive sectors helped healthcare, staples and utilities gain over the week, while technology, consumer discretionary, and industrials lagged.
- The 10-year U.S. Treasury yield rose another 13 basis points (bps), while the 2-year Treasury was 6 bps lower. As a result, the yield curve steepened for the second straight week after inverting briefly at the end of March and early April.
- March U.S. headline inflation was +8.5% year-over-year for consumer prices and +11.2% for producer prices. However, the news wasn’t all bad as core inflation, which strips out volatile food and energy prices, was up less than expected for both measures. Still, the high inflation readings likely mean the Fed will move forward aggressively with monetary tightening.
Stocks Slip in Shortened Week, Yields Climb Higher Yet
Equity markets endured yet more choppy trading as the prospects of an economic slowdown hang over investors as persistent inflation and the hostilities in Ukraine drag on. U.S. indexes finished the holiday-shortened week negative with the S&P 500 falling -2.1% and the Nasdaq Composite dropping -2.6%. The small cap Russell 2000 Index was able to manage a +0.5% gain. The ongoing war in Ukraine remains a key drain on markets, after several failed rounds of ceasefire talks and last week’s new sanctions on Russia from the U.S. and European Union. A rotation to defensive sectors helped healthcare, staples and utilities gain over the week, while technology, consumer discretionary, and industrials lagged.
Markets received their final look at the inflation picture before the Fed’s May monetary policy meeting and it didn’t bode well for the doves. Consumer inflation, as measured by CPI, came in at a 40-year high, while producer prices, as measured by PPI, jumped to an all-time. Inflation was likely peaking prior to Russia’s invasion of Ukraine. However, the ongoing war in Ukraine is keeping pressure on commodity prices and supply chain disruptions. The stronger-than-expected CPI and PPI reports reinforced the expectations that the Fed is set to get highly aggressive with tightening monetary policy. As a result, the Treasury yield curve steepened for a second straight week as long-term rates increased while rates on the short end of the curve declined. The yield on the U.S. 10-year Treasury note rose eight basis points to 2.78%, having topped out early in the week at a three and a half year high of 2.83%.
The week marked the start of Q1 earnings season with the big national banks in the Financials sector reporting mixed results. With only about 7% of the constituents of the S&P 500 Index having reported for Q1-2022, FactSet is reporting that blended earnings per share (which combines reported data with estimates for those that have yet to report) show growth is running at about +5.2%. The pace of earnings growth has slowed dramatically from the nearly +31.5% reported in Q4-2021. For Q1, FactSet is estimating year-over-year earnings growth of +4.5%, which would mark the lowest pace of growth since Q4-2020.
Chart of the Week
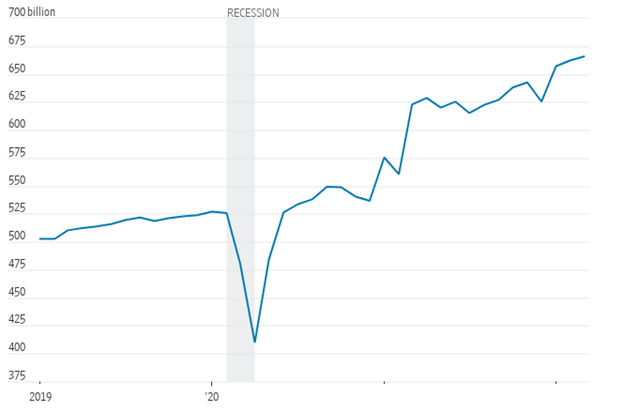
Americans continued to consume in March as retail and restaurant sales rose +0.5% from February, but much of that spending went to gas. The +0.5% gain in March was just short of expectations for +0.6%, and under February’s upwardly revised +0.8% rise. Retail sales are not adjusted for inflation and in real terms they were estimated to be down -0.7%, according to the Federal Reserve Bank of St. Louis and economist estimates. Sales at gas stations jumped +8.9% over the previous month, reflecting sharply higher gas prices. Excluding gas prices, sales were down -0.3%. Purchases of cars and car parts also detracted, falling -1.9% in March, largely due to a shortage of cars on dealer lots. The report also indicates that consumers are moving away from pandemic spending habits as they increasingly spend money outside the house at restaurants or stores, rather than staying home and buying online. Spending at bars and restaurants was up +1% in March, and clothing and accessory stores saw a +2.6% rise in spending. Overall, the data suggests consumers are still taking higher consumer prices in stride.
Americans kept up their buying habits in March
U.S. retail and food sales
Source: US. Census Bureau via St Louis Fed, The Wall Street Journal. Note: Seasonally adjusted.
Economic Review
- The March Consumer Price Index (CPI) was up +1.2%, matching expectations and the +0.8% gain in February. Core CPI, which excludes the more volatile food and energy components, was up +0.3%, below expectations for an unrevised +0.5% in February. Year-over-year, CPI was up +8.5%, which was the fastest rate since 1981, above expectations for +8.4%, and above February’s unrevised 7.9% annual gain. Core CPI was up +6.5% annually, just under expectations for a +6.6% gain, and up from February’s unrevised 6.4% rise.
- The March Producer Price Index (PPI) rose +1.4%, above expectations for a +1.1% gain and February’s upwardly revised +0.9%. Core PPI rose +1.0%, above expectations of +0.5% and February’s upwardly revised +0.4%. Year-over-year, PPI was up +11.2%, well above the upwardly revised +10.3% in February, as well as expectations for +10.6%. Core PPI rose +9.2% annually, above expectations of +8.4% and above February’s upwardly revised +8.7% increase.
- The March Import Price Index rose +2.6%, beating expectations for a +2.3% gain, and above February’s upwardly revised +1.6% rise. Year-over-year, import prices were up +12.5%, above expectations of +11.9% and February’s upwardly revised rise of +11.3%.
- The March National Federation of Independent Business (NFIB) Small Business Optimism Index fell to 93.2 from 95.7 in February, and below expectations for a decline to 95.0. It was the third consecutive month below its long-term average of 98, with 31% of business owners reporting inflation as the single most important problem in their business, up five points from February and the highest reading since Q1-1981, replacing “labor quality” as the number one problem.
- The April preliminary University of Michigan Consumer Sentiment Index unexpectedly improved, rising to 65.7 from 59.4 in March, and far above expectations of 59.0. The index bounced off the lowest level since 2011 as the expectations component of the report posted the largest monthly increase since 2006, per Bloomberg, and the current conditions portion of the survey also improved. Sentiment was boosted by the strong jobs market and wage expectations, which countered multi-decade high inflation. The 1-year inflation expectation remained at 5.4%, versus the expected 5.6% rate, the highest since December of 1981.
- March Industrial Production was up +0.9%, beating expectations and its third straight monthly increase following a +1.2% rise in February. It rose at an annual rate of +8.1% for the first quarter and was +5.5% above its year-earlier level to reach the highest it has been since 2008. Capacity Utilization rose to 78.3%, beating expectations, and is 1.2 percentage points below its long-run (1972–2021) average.
- The April New York Fed Empire State Manufacturing Index rebounded strongly with a rise to 24.6 versus -11.8 in March, and far above expectations for a rise to 0.5. The better-than-expected report saw new orders, prices paid (new record), and shipments lead the way higher.
- Weekly Unemployment claims unexpectedly rose by 18,000 to 185,000, above estimates of 170,000 and the prior week’s upwardly revised 167,000. Continuing claims, a proxy for the total number of people on unemployment rolls through regular state programs, fell by 48,000 to 1,475,000, below estimates of 1,500,000.
- The weekly MBA Mortgage Application Index declined -1.3%, following the prior week’s decrease of -6.3%, the fifth-straight weekly decline. The Refinance Index fell -4.9%, more than offsetting a +1.4% gain for the Purchase Index. The average 30-year mortgage rate extended its climb, rising +23 basis points (bps) to 5.13%, and is up +186 bps from last year.
The Week Ahead
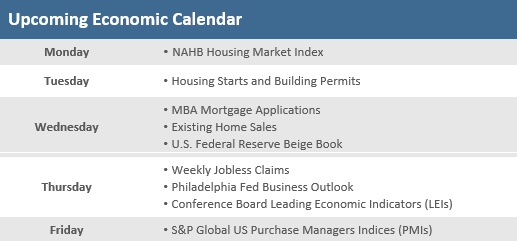
The upcoming week’s economic data is very light, predominately housing reports (NAHB Housing Market Index, housing starts, building permits, and existing home sales), but also including the Conference’s Board Leading Economic Indicators, which will provide a glimpse of economic expectations for the next six months. Wednesday’s release of the Fed’s Beige Book has the potential to move markets given it is a report on U.S. business activity that is used by the Fed to prepare for its May 4 monetary policy decision. Friday brings S&P Global’s preliminary April Manufacturing and Services PMIs. With the dearth of economic data, markets may key off earnings season, which begins to ramp up during the week.
Did You Know?
COSTS MORE – Since 12/31/2021, the average “principal and interest” (P+I) payment on a 30-year fixed rate mortgage has increased $92/month per $100,000 borrowed. On 12/31/2021, the nationwide average mortgage rate of 3.11% translated into a monthly “P+I” of $428 per $100,000 borrowed. On 4/07/2022, the average mortgage rate of 4.72% translated into a monthly “P+I” of $520 per $100,000 borrowed (source: Freddie Mac, BTN Research).
WHO IS THE BUYER? – Investors, not homebuyers, are behind 33% of the purchases of single-family homes in the United States in today’s market, up 5 percentage points from the 28% of buyers that investors represented over the past decade (source: John Burns Real Estate Consulting, BTN Research).
TO THE SENATE – The House of Representatives passed HR # 2954 on 3/29/2022 (“Securing a Strong Retirement Act”), now sending the bill to the Senate. The legislation, designed to overhaul the current pre-tax retirement system in the US, includes an expansion of auto-enrollment in retirement plans, an increase in the age at which individuals must begin “required minimum distributions” from age 72 to age 75 and improving the access to employer-sponsored plans to part-time workers (source: HR # 2954, BTN Research).
This Week in History
Makeover – On April 11, 1792, in the wake of the nation’s first stock market crash a month earlier, the New York State legislature enacted a law banning public stock auctions, the Act to Prevent the Pernicious Practice of Stock-Jobbing and for Regulating Sales at Public Auction (say that 10 times fast!). The new law notwithstanding, stock trading continued (source: The Wall Street Journal).
Asset Class Performance
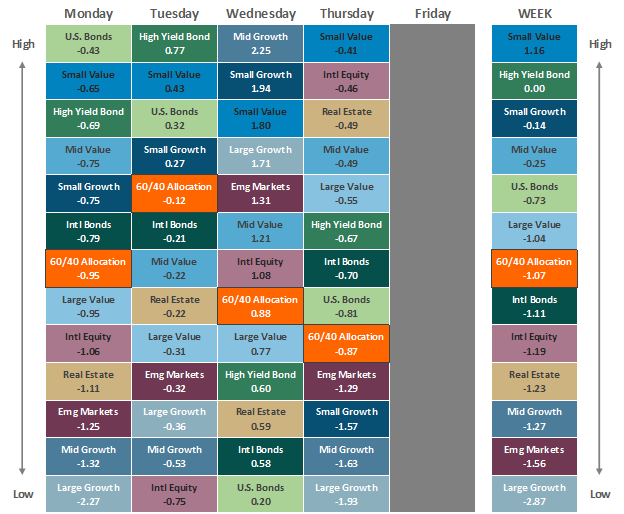
Source: Bloomberg. Asset‐class performance is presented by using market returns from an exchange‐traded fund (ETF) proxy that best represents its respective broad asset class. Returns shown are net of fund fees for and do not necessarily represent the performance of specific mutual funds and/or exchange-traded funds recommended by The Retirement Planning Group. The performance of those funds may be substantially different than the performance of the broad asset classes and to proxy ETFs represented here. U.S. Bonds (iShares Core U.S. Aggregate Bond ETF); High‐Yield Bond (iShares iBoxx $ High Yield Corporate Bond ETF); Intl Bonds (SPDR® Bloomberg Barclays International Corporate Bond ETF); Large Growth (iShares Russell 1000 Growth ETF); Large Value (iShares Russell 1000 Value ETF); Mid Growth (iShares Russell Mid-Cap Growth ETF); Mid Value (iShares Russell Mid-Cap Value ETF); Small Growth (iShares Russell 2000 Growth ETF); Small Value (iShares Russell 2000 Value ETF); Intl Equity (iShares MSCI EAFE ETF); Emg Markets (iShares MSCI Emerging Markets ETF); and Real Estate (iShares U.S. Real Estate ETF). The return displayed as “Allocation” is a weighted average of the ETF proxies shown as represented by: 30% U.S. Bonds, 5% International Bonds, 5% High Yield Bonds, 10% Large Growth, 10% Large Value, 4% Mid Growth, 4% Mid Value, 2% Small Growth, 2% Small Value, 18% International Stock, 7% Emerging Markets, 3% Real Estate.
Chris Bouffard is CIO of The Retirement Planning Group (TRPG), a Registered Investment Adviser. He has oversight of investments for the advisory services offered through TRPG.
Disclaimer: Information provided is for educational purposes only and does not constitute investment, legal or tax advice. All examples are hypothetical and for illustrative purposes only. Past performance of any market results is no assurance of future performance. The information contained herein has been obtained from sources deemed reliable but is not guaranteed. Please contact TRPG for more complete information based on your personal circumstances and to obtain personal individual investment advice.


