Quick Takes
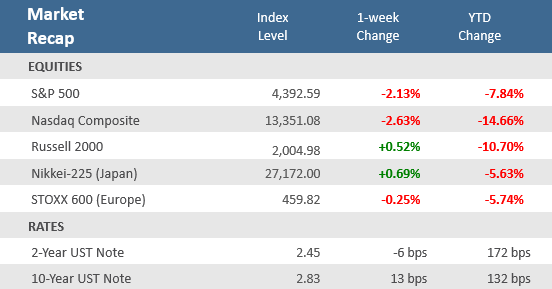
- Stocks posted another down week with inflation worries and the Russia-Ukraine was lingering as headwinds On Friday, the S&P 500 and Nasdaq 100 indices had their worst sessions since March 7 – the technology-heavy Nasdaq 100 is on track for its worst month since 2008.
- The 10-year U.S. Treasury yield rose another 7 basis points (bps), but it was the 2-year Treasury – more sensitive to rate-hike expectations – really sold off with Fed Chair Powell’s hawkish commentary and its yield popped 22 bps higher in the week. That left the yield curve flatter for the first week in the last three, but it is still 23 bps from turning negative again.
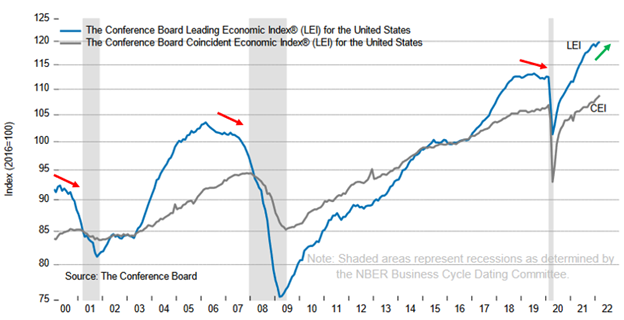
- The Conference Board’s Leading Economic Index (LEI) rose +0.3% in March, matching expectations and hitting a new record high (119.8). Results were robust with seven out of the ten index components advancing. Historically, this indicator weakens ahead of recessions and its continued ascent points to economic growth through the rest of 2022.
Global equities sink on earnings and rate-hike jitters
Investors are getting increasingly anxious about the Federal Reserve’s plans to aggressively raise interest rates as well as a slowdown in corporate earnings, sending stocks to their third consecutive week. For the first half of the week, it looked like stocks were going to break that losing streak. As market opened Thursday morning the S&P 500 moved up +2.7% for the week. Shortly thereafter, in a panel discussion, Federal Reserve Chairman Jerome Powell stated his support for moving faster on raising interest rates to cool inflation. From that point on, following the hawkish comments, the markets steadily sold off ¬¬– all day Thursday and all-day Friday, to leave the benchmark down -2.8% for the week. To put that in context, the S&P 500 went nearly a year without a -5% drawdown, from 10/30/2020 to 9/30/2021. And in less than two full trading sessions it dropped -5.3%. Growth and technology stocks were hit particularly hard. The tech-heavy Nasdaq Composite index was up +2.6% for the week just after the open on Thursday morning, and then Powell’s comments started its selloff which took it down -6.3% by Friday’s close, to end the week down -3.8%. Powell’s remarks essentially confirmed that the Fed will make a half percentage point rate hike at its May policy meeting, and the central bank also likely to announce the beginning of the unwinding of its balance sheet.
The Fed’s hawkish tone also further perpetuated the relentless rise in Treasury yields, especially at the short end of the curve. The yield on the U.S. 10-year Treasury note rose 7 basis points (bps) to close at 2.90%, but the 2-year Treasury yield jumped 22 bps over the week to close at 2.67%. The higher yields may be finally providing competition to equities. For years, U.S. stocks had been nicknamed TINA, for “There Is No Alternative”, meaning bond yields were so low they weren’t worth holding for investors looking for returns. Suddenly the jump in yields have coincided with $30 billion of equity fund outflows over the past two weeks, the largest amount since the March 2020 pandemic selloff, according to EPFR data and Deutsche Bank.
Earnings also may be weighing on investors after some late week disappointments helped sink the market. On Friday, Verizon shares lost -5.6%, Gap shares sank -18%, and HCA Healthcare dropped -21.8% following disappointing quarterly earnings results. Overall though, the earnings season has delivered decent results, with beat rates largely in line with recent quarters. Expectations for earnings had declined in recent months as Wall Street analysts pulled back estimates on weaker economic growth projections. According to Bloomberg, with 98 S&P 500 companies reported thus far, Q1 earnings show roughly 65% have topped revenue estimates and about 79% have beaten earnings projections. Earnings season will shift into high gear in the upcoming week with 146 S&P 500 companies slated to report, including tech giants Apple, Microsoft, Amazon and Alphabet (Google). Coca-Cola and Activision Blizzard will kick off the party on Monday.
Chart of the Week
The March Conference Board’s Leading Economic Index (LEI) rose +0.3%, matching expectations and hit a new record high (119.8), though the rate of growth was slower than February’s upwardly revised +0.6% rise. The LEI rebounded for a second-straight month after falling in January which was the first negative monthly reading since February 2021. Results were robust with seven out of the ten index components advancing. Historically, this indicator weakens ahead of recessions. It has peaked approximately 12 months on average before each of the last 8 recessions, and the minimum lead time of a recession after a peak was seven months. We can’t know if the March new record high will be a peak or if it will continue to ascend, but history indicates we will see economic growth continue throughout the rest of 2022.
Reset the recession clock, the LEI suggests economic growth through 2022
The LEI rose again despite headwinds from the war in Ukraine and inflation
Economic Review
- The April National Association of Home Builders (NAHB) Housing Market Index showed homebuilder sentiment slid to 77 from an unrevised 79 in March, but in line with expectations. It was fourth straight monthly decline, and it was the lowest level in seven months. The NAHB said, “Despite low existing inventory, builders report sales traffic and current sales conditions have declined to their lowest points since last summer as a sharp jump in mortgage rates and persistent supply chain disruptions continue to unsettle the housing market.” The average rate on the 30-year fixed mortgage stood at around 3.90% at the beginning of March, and is now up to 5.15%, according to Mortgage News Daily.
- March Housing Starts rose +0.3% to an annual pace of 1,793,000 units, above expectations for a decline to 1,740,000, and above February’s upwardly revised pace of 1,788,000. Building Permits, one of the leading indicators tracked by the Conference Board as it is a gauge of future construction, increased by +0.4% to an annual rate of 1,873,000, above expectations of 1,820,000, and compared to the upwardly revised 1,865,000 units in February.
- March Existing Home Sales decreased -2.7% to an annual rate of 5.77 million units, in line with expectations, while February was adjusted lower to 5.93 million units. Contract closings hit the lowest since June 2020, as sales in three of the four major U.S. regions fell for the month, while sales in the West held steady. Compared to last year, sales were lower in all regions. The Median Existing Home Price was up +15.0% from last year to a record high $375,300 and are up for 121 straight months as prices grew in each region. Unsold inventory was at a 2.0-months pace at the current sales rate, up from the from the 1.7-months pace a year earlier. Existing home sales account for a large majority of the home sales market and reflect contract closings instead of signings.
- The weekly MBA Mortgage Application Index declined -5.0%, following the prior week’s decrease of -1.3%, the sixth-straight weekly decline. The Refinance Index fell -7.7%, and the Purchase Index fell -3.0%. The average 30-year mortgage rate extended its climb, rising +7 basis points (bps) to 5.20%, and is up +200 bps from last year.
- The Fed’s Beige Book showed that while the U.S. economy grew steadily through early April, inflation showed little signs of abating, with firms in most Districts expecting inflationary pressure in the coming months. Regarding the ambiguity surrounding the outcome of the war in Ukraine, “Outlooks for future growth were clouded by the uncertainty created by recent geopolitical developments and rising prices. The shortage of available workers was prevalent, making it difficult to recruit and retain staff, even amid an increase in wages.
- The preliminary S&P Global U.S. Manufacturing PMI Index rose to 59.7 in April from an unrevised 58.8 in March – expectations were for a decrease to 58.0. Meanwhile, the S&P Global U.S. Services PMI Index unexpectedly slowed to 54.7, well below expectations to remain at March’s 58.0 level. S&P Global said the reports signaled a strong, but slower increase in business activity across the U.S. economy. Although still faster than January’s omicron-induced slowdown, overall growth was dampened by pressure on consumer spending as prices continued to rise.
- The April Philly Fed Manufacturing Business Outlook Index fell more than expected but remains well into expansion territory (a reading above zero). The index slid to 17.6 versus expectation of a fall to 21.4 from 27.4 in March. New Orders and Shipments both saw growth decelerate, but Employment Growth accelerated, while Prices Paid intensified and continued to expand at a severely elevated pace.
- Weekly Initial Jobless Claims were 184,000, for the week ended April 16, beating expectations of 180,000, and down from the prior week’s upwardly revised 186,000. Continuing Claims for the week ended April 9 dropped by 58,000 to 1,417,000, below expectations of 1,459,000.
The Week Ahead
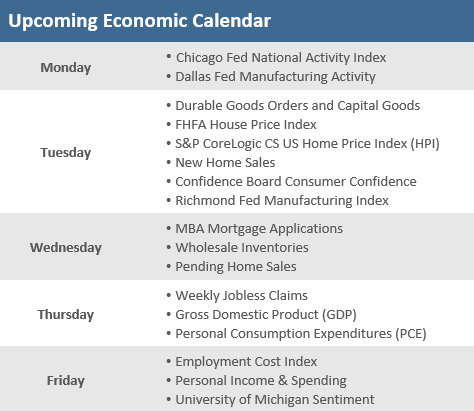
The calendar gets a lot busier with both economic and earnings reports in the coming week. Some economic reports worth noting are the Conference Board’s April Consumer Confidence report, new home sales, and the first read (of three) on Q1-2022 GDP. Earnings season will shift into high gear with several notable reports in the week including Apple and Microsoft, along with fellow mega-caps Amazon and Alphabet (Google). Federal Reserve officials, who have sparked a lot of headlines and attention the last couple of weeks, will stay out of the limelight as the Fed’s quiet period goes into effect for the week before its May 3-4 policy meeting.
Did You Know?
HARD TO CATCH UP – A 30-year old who is investing $500 at the beginning of every month in a tax-deferred 401(k) will accumulate $588,032 by age 60 if the funds grow at +7% per year. If that individual was forced to suspend his/her monthly deferral for just 5 years from ages 35-39, he/she would have to earn +8.8% per year from ages 40-60 to accumulate $588,032 by age 60. This mathematical calculation ignores the impact of taxes on the account which are due upon withdrawal, is for illustrative purposes only and is not intended to reflect any specific investment. Actual results will fluctuate with market conditions and will vary (source: BTN Research).
HELP WANTED – In March, there were about 1.1 jobless claims filed for every 1,000 people in the labor force, the lowest ratio ever recorded in data going back to 1967. The hot labor market has prompted employers to hold onto their workers and resulted in the lowest number of weekly unemployment claims filed in about 54 years. The labor force is more than twice as large as it was back then (source: The Wall Street Journal).
75 BPS BLUFF? – St. Louis Fed President James Bullard said he wouldn’t “rule out” a 75 basis-point increase, “but it isn’t my base case.” The market has priced in a 50-basis-point hike for the May meeting, kicking off a ramped-up tightening cycle. Bullard emphasized that the fed funds rate should be lifted to 3.5% at a minimum by the end of this year. The Federal Open Market Committee, during its March meeting, hiked the interbank lending rate by 25 basis points off the effective zero lower bound, the first interest rate hike since 2018.
This Week in History
IBM IS BORN – On April 19, 1895, the Railroad Gazette published the first description for a business audience of engineer Herman Hollerith’s “electric tabulating machine,” a new data-processing device that used electrical signals to read, count and sort punch cards on which data were represented by an array of holes. Hollerith’s company, the Tabulating Machine Co., was one of the ancestors of IBM (source: The Wall Street Journal).
Asset Class Performance
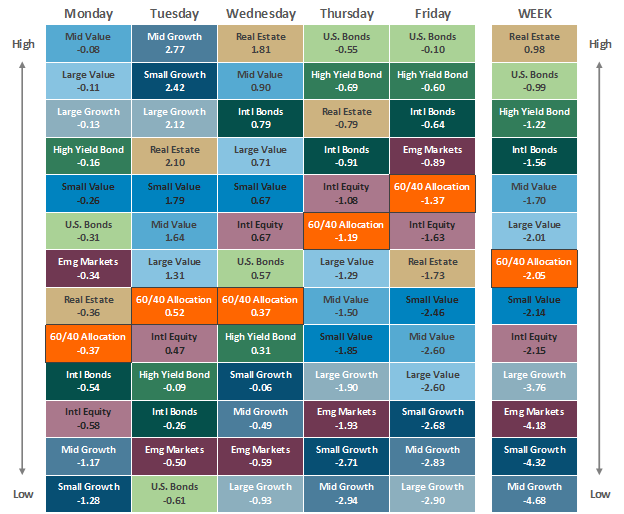
Source: Bloomberg. Asset‐class performance is presented by using market returns from an exchange‐traded fund (ETF) proxy that best represents its respective broad asset class. Returns shown are net of fund fees for and do not necessarily represent the performance of specific mutual funds and/or exchange-traded funds recommended by The Retirement Planning Group. The performance of those funds may be substantially different than the performance of the broad asset classes and to proxy ETFs represented here. U.S. Bonds (iShares Core U.S. Aggregate Bond ETF); High‐Yield Bond (iShares iBoxx $ High Yield Corporate Bond ETF); Intl Bonds (SPDR® Bloomberg Barclays International Corporate Bond ETF); Large Growth (iShares Russell 1000 Growth ETF); Large Value (iShares Russell 1000 Value ETF); Mid Growth (iShares Russell Mid-Cap Growth ETF); Mid Value (iShares Russell Mid-Cap Value ETF); Small Growth (iShares Russell 2000 Growth ETF); Small Value (iShares Russell 2000 Value ETF); Intl Equity (iShares MSCI EAFE ETF); Emg Markets (iShares MSCI Emerging Markets ETF); and Real Estate (iShares U.S. Real Estate ETF). The return displayed as “Allocation” is a weighted average of the ETF proxies shown as represented by: 30% U.S. Bonds, 5% International Bonds, 5% High Yield Bonds, 10% Large Growth, 10% Large Value, 4% Mid Growth, 4% Mid Value, 2% Small Growth, 2% Small Value, 18% International Stock, 7% Emerging Markets, 3% Real Estate.
Chris Bouffard is CIO of The Retirement Planning Group (TRPG), a Registered Investment Adviser. He has oversight of investments for the advisory services offered through TRPG.
Disclaimer: Information provided is for educational purposes only and does not constitute investment, legal or tax advice. All examples are hypothetical and for illustrative purposes only. Past performance of any market results is no assurance of future performance. The information contained herein has been obtained from sources deemed reliable but is not guaranteed. Please contact TRPG for more complete information based on your personal circumstances and to obtain personal individual investment advice.

