Quick Takes
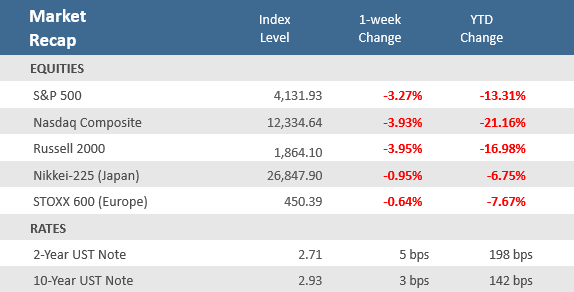
- Stocks posted their fourth week of losses, every week in April, leading to the worst month for the S&P 500 since March 2020. Persistent inflation, supply chain issues, and challenging labor markets remain key headwinds.
- Big earnings disappointments with several high-profile technology-related companies pushed the Nasdaq to drop nearly -4% in the week, and back into bear market territory for the year, at -21.2%. Small caps were also down nearly -4% on the week.
- The U.S. economy unexpectedly shrank in the first quarter of the year. Gross Domestic Product (GDP), contracted -1.4% on an annualized basis, badly missing economists’ expectations for a slow down to +1.0% from the +6.9% annual rate recorded at the end of 2021.
April showers markets with worst losses since March 2020
Markets remain schizophrenic with a decidedly downside bias. The S&P 500 lost -3.6% on Friday, after jumping +2.6% on Thursday, which followed a -2.8% drop on Wednesday. As a result, the Cboe VIX Volatility Index jumped 5 points, or nearly +20%, to close the week at 33.4% which is just under the highs of the year recorded the early March downdraft. It was the fourth straight week of losses for stocks – every week of April – leaving the S&P 500 with its largest monthly decline since March of 2020. The usual suspects remain the culprits wearing on investors; aggressive Fed tightening expectations, the ongoing war in Ukraine, China’s COVID lockdowns, surging bond yields, and the persistent rally in the U.S. dollar.
An unexpected miss on the first estimate of Q1-2022 gross domestic product (GDP, the broadest measure of U.S. economic output) also pressured markets. It was broadly expected that U.S. economic growth would slow materially in the first quarter, but the -1.4% contraction reported on Thursday was far below the +1.0% gain economists were calling for. While consumer spending was solid, rising +2.7%, a big US trade deficit, lower government spending and a decline in inventory investment pulled the overall figure into negative territory. The GDP Price Index showed inflation at an +8.0% increase, above expectations of +7.2%, reinforcing the persistent pricing pressure shown across numerous other inflation gauges.
Earnings season has only exacerbated the downside trend as companies cite broken supply chain issues, surging inflation, and tight labor markets as headwinds to profits. It only took a few high-profile technology-oriented companies to sink an otherwise decent earnings season. Netflix and Amazon were down double-digits for the week after disappointing earnings reports. Bloomberg reported data from Goldman Sachs that shows the average S&P 500 stock has moved 4.2% in either direction after reporting earnings this quarter, the most since the last quarter of 2011. That compares with an average price change of 3.4% in the prior 65 quarters. S&P 500 earnings growth is tracking +4.3% year-on-year, with about 86% of companies beating estimates, according to Barclays strategists.
Chart of the Week
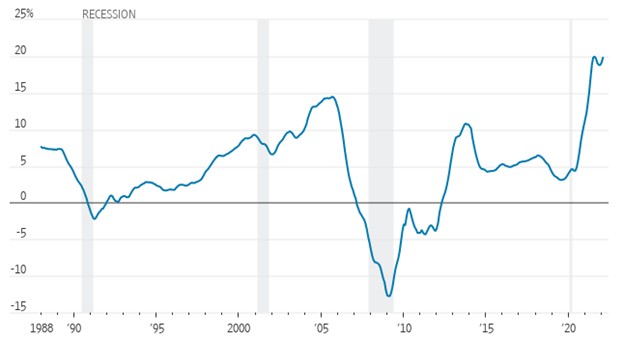
The S&P CoreLogic Case-Shiller National Home Price Index, which measures average home prices in major metropolitan areas across the U.S., rose +19.8% in the year that ended in February, up from a +19.1% annual rate in January. February marked the highest annual rate of price growth since August. The low inventory of homes for sale has made it difficult for buyers to compete and pushed prices higher. In addition to higher home prices, the average 30-year mortgage rate jumped from 3.1% at the end of 2021 to 5.0% by mid-April, adding hundreds of dollars to the typical monthly mortgage payment. Economists expect home-price growth to begin to slow in the coming months as rising mortgage interest rates reduce buyers’ purchasing power and price some shoppers out of the market.
S&P CoreLogic Case-Shiller national home-price index
Change from one year earlier
Source: Dow Jones Indices, The Wall Street Journal.
Economic Review
- The first estimate (of three) for Q1-2022 Gross Domestic Product (GDP), the broadest measure of U.S. economic output, showed a quarter-over-quarter annualized rate of contraction of -1.4%, far below expectations for a +1.0% gain. That follows an unrevised +6.9% increase in Q4-2021. Personal Consumption rose by +2.7%, compared to forecasts of a +3.5% gain, and following the unadjusted +2.5% increase recorded in Q4. On inflation, the GDP Price Index came in at an +8.0% increase, above expectations of +7.2% and the unrevised +7.1% rise in Q4-2021, while the Core PCE Price Index, which excludes food and energy, rose +5.2%, below expectations of +5.5%, but above the unadjusted +5.0% increase in Q4-2021.
- The April Conference Board Consumer Confidence Index slipped to 107.3 from an upwardly revised 107.6 in March, and under expectations of 108.2. The Expectations Index component of business conditions for the next six months increased to 77.2 from March’s upwardly revised 76.7, while the Present Situation Index portion of the survey fell to 152.6 from March’s upwardly revised 153.8.
- March New Home Sales fell -8.6% to an annual rate of 763,000 units, below expectations for a rate of 768,000 units, and below February’s upwardly revised 835,000 units. The median home price rose +21.4% over the prior year to $436,700. New home inventory rose to 6.4 months from February’s level of a 5.6-months’ supply at the current sales pace. Sales fell month-over-month in all four regions. Sales in the Midwest and South were lower year-over-year, while sales in the West were higher, and sales in the Northeast were flat.
- March Pending Home Sales fell -1.2%, the fifth-straight monthly fall, and more than expectations of -1.0%, but better than February’s upwardly revised -4.0% drop. Sales tumbled -8.9% on a year-over-year basis, worse than the expected -8.1% decline and February’s upwardly revised -5.2% decline. Pending home sales reflect contract signings and are a gauge of the pipeline of existing home sales.
- The April Dallas Fed Manufacturing Index fell to 1.1 from 8.7 in March, more than the expected decline to 5.0, but was still in expansion territory (a reading above zero). Despite the larger-than-expected decline, new orders and shipments both accelerated. Inflation pressures eased but remained elevated.
- The Richmond Fed Manufacturing Activity Index remained in expansion territory (a reading above zero) rising to 14 from 13 in March, beating expectations of 9. Capacity utilization and shipments rose, while new orders fell, but all remained in positive territory.
- The April Kansas City Fed Manufacturing Activity Index fell more than expected but remained at a level depicting expansion (a reading above zero). The index dropped to 25 from March’s unrevised 37 reading, compared to forecasts calling for a decline to 35.
- The Chicago PMI fell more than expected but remained in expansion territory (a reading above 50), coming in at 56.4 in April down from 62.9 in March and well below expectations of 62.0. New orders and production decelerated, and the contraction in employment accelerated.
- March preliminary Durable Goods Orders rose +0.8% month-over-month, below expectations of +1.0% and February’s upwardly revised -1.7% decline.
- March Personal Income was up +0.5% month-over-month, beating expectations for a +0.4% gain, but under February’s upwardly revised +0.7% increase. Personal Spending was up +1.1%, also ahead of expectations of +0.6%, and the prior month’s upwardly revised +0.6%. The savings rate as a percentage of disposable income was 6.2%, down from February’s negatively revised 6.8% rate.
- The PCE Deflator was up +0.9% month-over-month, in line with expectations, and up from February’s downwardly revised +0.5%. Compared to last year, the deflator was up +6.6%, just missing expectations for a +6.7% increase, and above the prior month’s downwardly revised +6.3%. The PCE Core Price Index, which excludes food and energy, rose +0.3% for the month, in line with expectations and February’s downwardly revised rate. On an annual basis, the index was +5.2% higher, shy of estimates to match of February’s downwardly revised +5.3%.
- The April final University of Michigan Consumer Sentiment Index was unexpectedly revised lower to 65.2, from the preliminary 65.7 figure, where it was expected to remain. The expectations component of the survey was adjusted lower to more than offset an upward revision to the current conditions component. Still, the overall index was above March’s 59.4 level as both current conditions and expectations improved for the month.
- The weekly MBA Mortgage Application Index declined -8.3%, following the prior week’s decrease of -5.0%, the seventh-straight weekly decline. The Refinance Index fell -9.0%, and the Purchase Index fell -7.6%. The average 30-year mortgage rate extended its climb, rising +17 basis points (bps) to 5.37%, and is up +220 bps from last year.
- Weekly Initial Jobless Claims were 180,000, for the week ended April 16, matching expectations, and down from the prior week’s upwardly revised 185,000. Continuing Claims for the week ended April 16 dropped by 1,000 to 1,408,000, below expectations of 1,399,000.
The Week Ahead
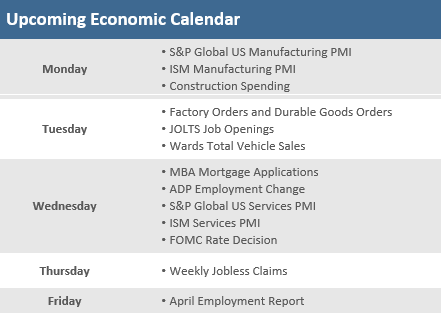
The calendar is chock full of economic and earnings reports in the week ahead. On the macroeconomic front, factory orders, durable goods orders, the S&P Global PMIs and competing ISM PMIs will give a broad read on U.S. economic activity. JOLTS job openings, ADP Employment Change, and the April Nonfarm Payrolls employment reports will give a broad read on the labor market. Midweek gives the much anticipated Fed rate hike decision, which most expect to bring a 50 basis point rate hike, but the odds of a 75 basis point hike has been increasing. Of course, earnings season continues, and after big name tech stocks sank the market this past week, investors will be watching reports from more tech heavyweights in the week ahead.
Did You Know?
KING DOLLAR – The WSJ Dollar Index, which measures the U.S. currency against a basket of 16 others, has risen +7.1% in 2022. The dollar has climbed in all but two of the last 21 trading sessions, putting it within striking distance of a 20-year high (source: The Wall Street Journal).
BIG SWINGS – The yield on the 10-year U.S. Treasury note was cut in half during the first year of the pandemic (2020), falling from 1.91% on 12/31/2019 to 0.91% on 12/31/2020. That movement in rates has flipped around in the first 16 weeks of 2022 as the yield on the 10-year Treasury note has nearly doubled, rising from 1.50% on 12/31/2021 to 2.89% as of Friday 4/29/2022 (source: Treasury Department, BTN Research).
PROPERTY TAXES – The average property taxes paid on a single-family home in the United States in 2021 was $3,719, equal to 0.9% of the fair market value of the average home nationwide (source: Attom Data Solutions, BTN Research).
This Week in History
WSJ RATE HIKE HEADLINE TANKS MARKET – Sounds familiar, almost like recent headlines, but this is from 1998. On April 27, 1998, an article in The Wall Street Journal titled “Fed Officials Are Pondering Interest Rate Boost in Future” sent bonds and stocks tumbling. At one point the S&P 500 was down -2.8% during the day before recovering to close down -1.9%. Prior to that WSJ article, the S&P 500 was sitting on a +47.2% one-year trailing total return. The yield on the 10-year U.S. Treasury jumped from 5.66% to 5.78%, which was its largest one-day jump to that point in 1998. Stocks plummeted at the open on the mere suggestion that the Fed could choose to raise interest rates.
As the WSJ article described it the following day, “The threat of higher interest rates sent the bond market into a tailspin that, in turn, drove stock prices into the sharpest decline in more than three months.” The one-day stock drop eliminated more than $230 billion of value from the market and triggered a wave of investors to switch 401(k) investments from stock funds to bond funds and cash. But the knee-jerk reaction in the stock market was short-lived, and the S&P finished the week up +1.2% on a total return basis. In the 24 years since that interest-rate-fear induced decline (i.e., from 4/27/1998 to 4/27/2022) the S&P 500 has produced a total return (with dividends reinvested) of +502%, or +7.76% annually. Ironically, the next rate decision the Fed actually made was to cut rates by 0.25% in September 1998 in response to the Long-Term Capital Management hedge fund crisis (source: Benzinga, Bloomberg, The Wall Street Journal).
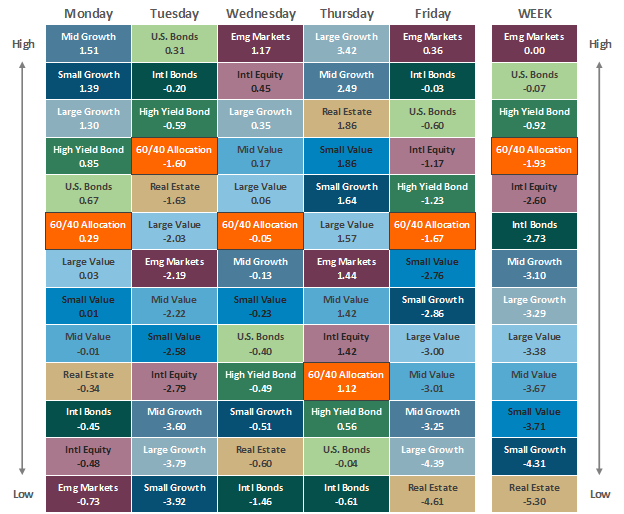
Asset Class Performance
Source: Bloomberg. Asset‐class performance is presented by using market returns from an exchange‐traded fund (ETF) proxy that best represents its respective broad asset class. Returns shown are net of fund fees for and do not necessarily represent the performance of specific mutual funds and/or exchange-traded funds recommended by The Retirement Planning Group. The performance of those funds may be substantially different than the performance of the broad asset classes and to proxy ETFs represented here. U.S. Bonds (iShares Core U.S. Aggregate Bond ETF); High‐Yield Bond (iShares iBoxx $ High Yield Corporate Bond ETF); Intl Bonds (SPDR® Bloomberg Barclays International Corporate Bond ETF); Large Growth (iShares Russell 1000 Growth ETF); Large Value (iShares Russell 1000 Value ETF); Mid Growth (iShares Russell Mid-Cap Growth ETF); Mid Value (iShares Russell Mid-Cap Value ETF); Small Growth (iShares Russell 2000 Growth ETF); Small Value (iShares Russell 2000 Value ETF); Intl Equity (iShares MSCI EAFE ETF); Emg Markets (iShares MSCI Emerging Markets ETF); and Real Estate (iShares U.S. Real Estate ETF). The return displayed as “Allocation” is a weighted average of the ETF proxies shown as represented by: 30% U.S. Bonds, 5% International Bonds, 5% High Yield Bonds, 10% Large Growth, 10% Large Value, 4% Mid Growth, 4% Mid Value, 2% Small Growth, 2% Small Value, 18% International Stock, 7% Emerging Markets, 3% Real Estate.
Chris Bouffard is CIO of The Retirement Planning Group (TRPG), a Registered Investment Adviser. He has oversight of investments for the advisory services offered through TRPG.
Disclaimer: Information provided is for educational purposes only and does not constitute investment, legal or tax advice. All examples are hypothetical and for illustrative purposes only. Past performance of any market results is no assurance of future performance. The information contained herein has been obtained from sources deemed reliable but is not guaranteed. Please contact TRPG for more complete information based on your personal circumstances and to obtain personal individual investment advice.

