Quick Takes
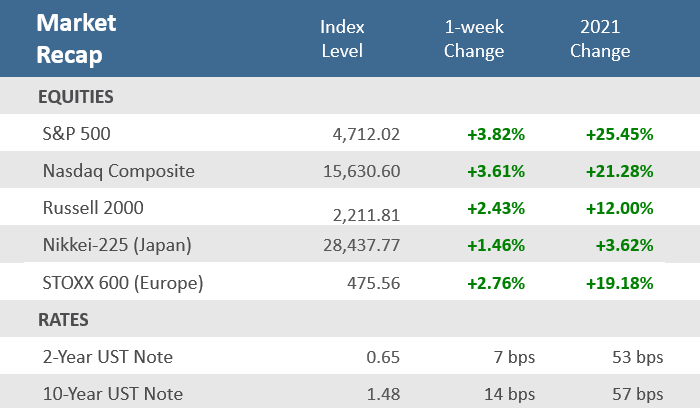
- Investors shrugged off the spread of Omicron and surging inflation to send the S&P 500 to a new record high, as it, and the Nasdaq, had their best week since February. Even small caps, laggards of late, had healthy gains with the Russell 2000 breaking a four-week losing streak.
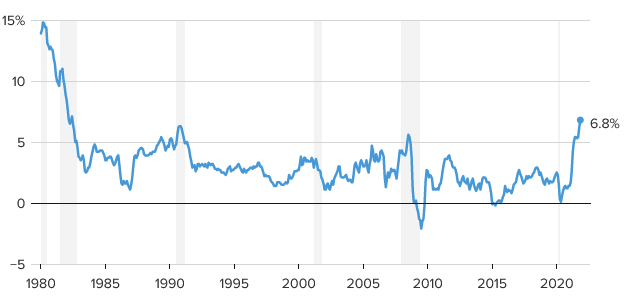
- The November Consumer Price Index (CPI) showed inflation rose +0.8% for the month, and +6.8% annually which is the fastest inflation rate since June 1982. Core CPI was up +0.5% for the month and +4.9% from a year ago, which was its fastest rate since mid-1991.
- Weekly jobless claims fell to their lowest level since 1969, when the country’s labor force was roughly half the size it is today. 184,000 workers filed for unemployment benefits in the most recent week, far below expectations for 220,000.
Markets shrug off Omicron and inflation to reach new record
Over the week Omicron was detected in Florida and Texas, making it at least 25 states with the variant. And inflation increased at the fastest rate since 1982. Either of those two data points would’ve weighed heavily on the markets in the prior few weeks. Yet neither were able to bother markets from advancing this past week. The S&P 500 gained +3.8% and closed at a new record high. The technology-focused Nasdaq Composite did nearly as well, with a +3.6% gain. It was the best week since February for both indices and ended a two-week losing streak for each. Even the small cap Russell 2000 Index was able to post a +2.4% advance, breaking a four-week losing streak. It was a key shift in sentiment for investors to be able to shrug off Omicron and inflation concerns. The Cboe VIX Volatility Index tumbled 12 points, or -39%, from 30.7 last week to 18.7 Friday. Data suggests that although the spread of the variant appears more efficient, the impact is likely to be less severe than the prior delta variant. Though the spike in inflation was the highest in nearly four decades, it was also highly anticipated and apparently fully priced into the market. The Treasury yield curve steepened a bit after several weeks of flattening with the benchmark 10-year Treasury note up 14 basis points (+0.14%) to 1.48%, while the 2-year yield was up only 7 basis points to a yield of 0.65%. Perhaps the market is in wait-and-see mode, with producer inflation (PPI), import prices and the Fed’s December meeting and statement upcoming this week.
Chart of the Week
The November Consumer Price Index, or CPI which measures the cost of a wide-ranging basket of goods and services, rose +0.8% for the month, and +6.8% annually which is the fastest inflation rate since June 1982. Excluding the more volatile food and energy prices, the so-called Core CPI, inflation was up +0.5% for the month and +4.9% from a year ago, which was its fastest rate since mid-1991. Not surprising to most Americans, energy prices led the surge in inflation having risen +33.3% since November 2020, after jumping +3.5% in November alone. Gasoline prices were a primary contributor to the energy inflation, up +58.1% in the last year. Shelter costs, which makes up a third of the CPI weighting, rose +3.8% from 2020, the highest annual increase since 2007.
Consumer Price Index (CPI), percent change from a year ago
All items in U.S. city average
Note: Shaded areas indicate U.S. recessions.
Source: Bureau of Labor Statistics, CNBC.
Economic Review
- The Job Openings and Labor Turnover Survey (JOLTS), a measure of unmet demand for labor, came in above even the highest forecast at 11.03 million job openings, far above the median estimate of 10.47, and just shy of July’s all-time high level. The hiring rate remained at September’s 4.4% level, and separations declined to 4.0% from the prior month’s 4.2% pace. The quit rate fell to 2.8% from September’s 3.0% pace. Private Sector Quits Rate were 3.1% as 3.95 million workers voluntarily decided to part ways in search of greener pastures. The ratio of job opening to unemployed people hit a hew all time high of 1.49 and the ratio of hires to job openings is the lowest on record.
- Weekly unemployment claims fell to just 184,000, well under expectations of 220,000, and the lowest level since September 6, 1969. Continuing claims rose by 38,000 to 1,992,000.
- October Wholesale Inventories were revised up to a +2.3% month-over-month gain from the previously reported +2.2%, versus estimates for it to remain unchanged. Sales were upwardly adjusted to a +2.2% gain from the prior +1.1% advanced estimate, and versus forecasts of a +1.0% gain.
- The preliminary December University of Michigan Consumer Sentiment Index was 70.4, beating expectations of 68.0 and November’s 67.4 reading, which was a ten-year low. Both the current conditions and the expectations portions of the index unexpectedly rose. The 1-year and the 5–10-year inflation forecasts are both still at November’s levels of 4.9% and 3.0%, respectively.
The Week Ahead
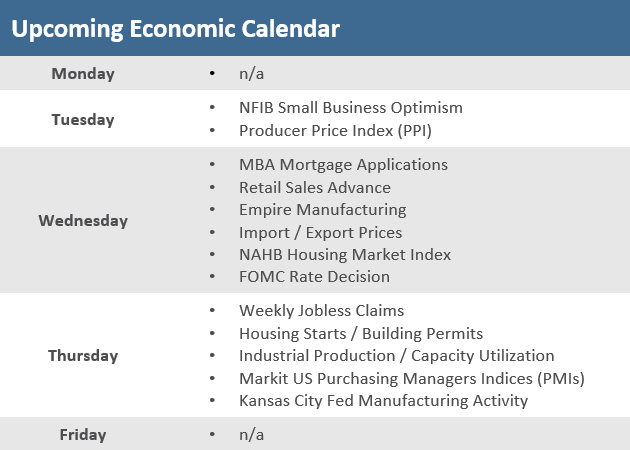
The upcoming economic calendar falls almost entirely on Wednesday and Thursday. The inflation picture will continue to come into focus with producer inflation (PPI) on Tuesday and import prices on Thursday. But most eyes and ears will be tuned into the Federal Open Market Committee (FOMC) rate decision and statement on Wednesday.
Did You Know?
START SAVING NOW — A child born in 2021 that begins kindergarten in the fall of 2026 would attend college between the years of 2039 and 2043. If that child attended an average public in-state 4-year college and if the annual price increases for public colleges that have occurred over the last 30 years (+4.9% per year) continued into the future, the aggregate 4-year cost of the child’s college education (including tuition, fees, room & board) would be $229,635 or $57,409 per year (source: College Board, BTN Research).
BAD MEDICINE — The SPDR S&P Biotech ETF, based on an equal-weighted index of biotech stocks, has fallen about -22% so far this year through Friday and is down -37% from its Feb. 8 peak. It is on pace for its worst calendar year since its inception in 2007. It has only been negative in 3 other calendar years, losing approximately -15.5% in 2016 and 2018, and dropping -9.7% in 2008. Meanwhile, the broader market, the S&P 500, has notched a total return of +25.5% in 2021 (source: WSJ, Bloomberg).
BIT IT — Bitcoin, the largest cryptocurrency by market value, plunged more than -20% to $42,000 at midnight Eastern Time on Saturday, December 4, before bouncing back some, according to data from CoinDesk. Other widely traded cryptocurrencies including Solana, Dogecoin, and Shiba Inu coin lost more than a fifth of their value. BITO, the Bitcoin futures ETF that incepted October 19, was down -9.3% for the week, has dropped in 5 of the 7 weeks since its IPO, and is down a total of -26.7% from the IPO (source: WSJ, Bloomberg).
This Week in History
This week in 1906, Grace Murray Hopper (nee Grace Brewster Murray) was born in New York City. She later served in the U.S. Navy, rising to the rank of rear admiral, and invented the Cobol computer language, one of the first software programs enabling computers to be used by non-mathematicians. She also invented the term “bug” for a glitch when, in 1945, she opened a malfunctioning computer and captured a moth inside that had been causing electrical relays to fail (source: The Wall Street Journal).
Asset Class Performance
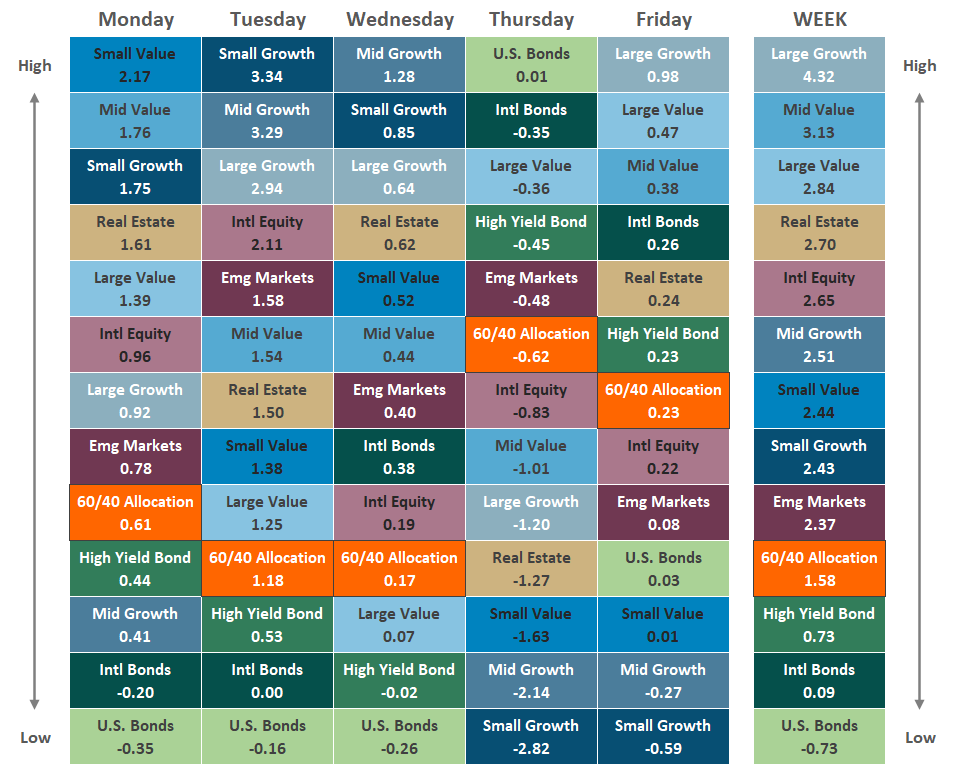
The Importance of Diversification. Diversification mitigates the risk of relying on any single investment and offers a host of long-term benefits, such as lowering portfolio volatility, improving risk-adjusted returns, and helping investments to compound more effectively.
Source: Bloomberg. Asset‐class performance is presented by using market returns from an exchange‐traded fund (ETF) proxy that best represents its respective broad asset class. Returns shown are net of fund fees for and do not necessarily represent the performance of specific mutual funds and/or exchange-traded funds recommended by The Retirement Planning Group. The performance of those funds may be substantially different than the performance of the broad asset classes and to proxy ETFs represented here. U.S. Bonds (iShares Core U.S. Aggregate Bond ETF); High‐Yield Bond (iShares iBoxx $ High Yield Corporate Bond ETF); Intl Bonds (SPDR® Bloomberg Barclays International Corporate Bond ETF); Large Growth (iShares Russell 1000 Growth ETF); Large Value (iShares Russell 1000 Value ETF); Mid Growth (iShares Russell Mid-Cap Growth ETF); Mid Value (iShares Russell Mid-Cap Value ETF); Small Growth (iShares Russell 2000 Growth ETF); Small Value (iShares Russell 2000 Value ETF); Intl Equity (iShares MSCI EAFE ETF); Emg Markets (iShares MSCI Emerging Markets ETF); and Real Estate (iShares U.S. Real Estate ETF). The return displayed as “Allocation” is a weighted average of the ETF proxies shown as represented by: 30% U.S. Bonds, 5% International Bonds, 5% High Yield Bonds, 10% Large Growth, 10% Large Value, 4% Mid Growth, 4% Mid Value, 2% Small Growth, 2% Small Value, 18% International Stock, 7% Emerging Markets, 3% Real Estate.
Chris Bouffard is CIO of The Retirement Planning Group (TRPG), a Registered Investment Adviser. He has oversight of investments for the advisory services offered through TRPG.
Disclaimer: Information provided is for educational purposes only and does not constitute investment, legal or tax advice. All examples are hypothetical and for illustrative purposes only. Past performance of any market results is no assurance of future performance. The information contained herein has been obtained from sources deemed reliable but is not guaranteed. Please contact TRPG for more complete information based on your personal circumstances and to obtain personal individual investment advice.

