Quick Takes
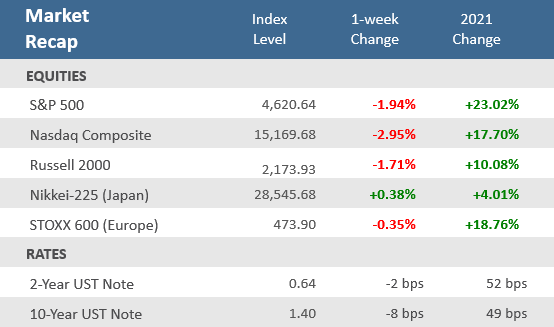
- Choppy trading continued as Omicron and Fed monetary policy stirred markets. Stocks gave up some of last week’s gains as investors weighed the impact of the Omicron variant on the economy and supply chains while processing the Fed’s new stance on tapering and inflation.
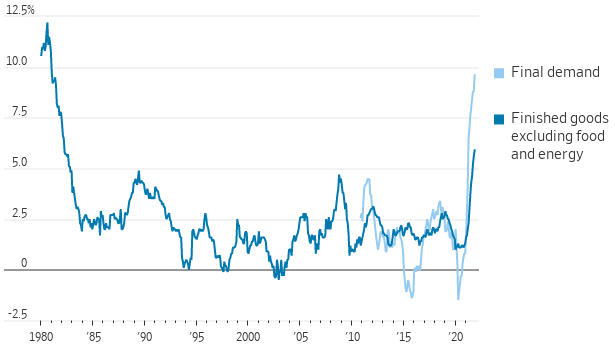
- Like the prior week’s Consumer Price Index (CPI), the November Producer Price Index (PPI) hit historic levels. Headline PPI surged 9.6% from last year, the fastest annual rate for data that dates back to 2010. Another similar, but more narrow, measure with more history was the highest since 1982.
- The Federal Open Market Committee (FOMC) set the stage for the Fed to accelerate the tapering of its asset purchase program and the majority of Fed members are now forecasting three interest rate hikes in 2022 to fight inflation.
Choppiness persists, stocks end the week lower
Two of the more prominent themes of the week were the continued rapid spread of Omicron and the Federal Reserve’s announcement that it would unwind its asset purchase program at twice the rate it previously projected to help fight inflation. The S&P 500 fell four out of five days on its way to a -1.9% weekly decline, which was its fourth negative week in the last five. Growth stocks were hit particularly hard, and the technology-heavy Nasdaq was the biggest laggard of the week, falling nearly -3.0%. On the variant front, on Tuesday, the World Health Organization (WHO) warned Omicron is spreading faster than previous strains, and it is probably present in every country of the world. Still, only one confirmed death from the new variant occurred on Monday in the U.K.
Monetary policy took over the financial headlines on Wednesday when the Federal Open Market Committee (FOMC) concluded its December monetary policy meeting and set the stage for the Fed to raise rates earlier and by more next year than it had previously projected. The majority of Fed members now forecast three 0.25 percentage point interest rate hikes in 2022 to fight inflation, whereas they were previously split on whether to raise rates at all. As widely expected, it was also confirmed that the Fed will double the rate of reduction of its bond purchases and conclude the program by March. The Committee provided updated economic projections, showing downward adjustments to GDP and the unemployment rate while increasing its forecast for inflation for 2021 and 2022. Accordingly, it formally removed the “transitory” language for inflation from its statement.
Meanwhile, in Washington DC, President Joe Biden signed a debt ceiling increase into law to prevent a U.S. default. The measure lifts the government’s borrowing limit by $2.5 trillion, which is expected to allow the U.S. to cover its obligations into 2023. Biden signed the bill a day after the Treasury’s estimated date when it would run out of tools to pay the country’s bills.
Chart of the Week
Wholesale prices, measured by the Producer Price Index (PPI), which are the prices that suppliers charge businesses, surged +9.6% in November from a year ago, beating expectations for a +9.2% rise and October’s +8.6% gain. The headline PPI, or the so-called, Producer Price Index for Final Demand, only has data back to 2010. The Producer Price Index for Finished Goods Excluding Food and Energy is an older but narrower version of the index, which measures prices for finished goods and the materials that go into them, posted its biggest annual gain since 1982.
Wholesale prices rose at the fastest pace on record
Annual change in the Producer Price Index for…
Source: Labor Department, WSJ.
Economic Review
- November’s Industrial Production showed that U.S. manufacturing, mining, and utility output rose +0.5% from the prior month, slightly less than expectations for a +0.6% rise, and below October’s upwardly revised +1.7% gain, still enough to mark the highest level since September 2019. Manufacturing, the most significant component of industrial production, has now surpassed its pre-pandemic level thanks to a rebound in activity outside the auto sector. Car companies are still struggling with supply chain issues, particularly semiconductor shortages. The report also showed that Capacity Utilization, a gauge of the manufacturing and production capabilities that U.S. firms are utilizing, increased to 76.8%, matching expectations, and slightly above October’s upwardly revised 76.5% level.
- The December preliminary Markit Manufacturing PMI Index fell to 57.8 from an unrevised 58.3 in November, below estimates for a gain to 58.5 (levels above 50 indicate economic expansion). The preliminary Services PMI declined to 57.5 from November’s 58.0, below expectations for a rise to 58.8.
- For November, the National Federation of Independent Business (NFIB) Small Business Optimism Index ticked up to 98.4 from 98.2 in October, matching expectations. Labor shortages and inventory shortages continue to be an issue, with the NFIB noting that business owners are pessimistic “as many continue managing challenges like rampant inflation and supply chain disruptions that are impacting their businesses right now.” On the other hand, the Economic Policy Uncertainty Index has moderated to 63% from a 2021 high of 83% in June and well off of the pandemic high of 98% in October 2020.
- For December, the National Association of Home Builders (NAHB) Housing Market Index showed that homebuilder sentiment ticked up to 84 from 83 in October, in line with estimates. The NAHB said, “Despite inflation concerns and ongoing production bottlenecks, builder confidence edged higher for the fourth consecutive month on strong consumer demand and limited existing inventory.” The report noted that while demand remains strong, finding workers, predicting pricing, and dealing with material delays remains a challenge.
- November Housing Starts were up +11.8% from the prior month to an annual pace of 1,679,000 units, well above expectations of 1,567,000 units and October’s downwardly revised pace of 1,502,000 units. Builders started work on almost 1.7 million housing units last month but completed fewer than 1.3 million, the widest gap since 1984. The number of homes under construction rose to the highest level since 1973. Building Permits, a gauge of future construction and one of the components in the Conference Board Leading Economic Indicators (LEI) index set to report in the upcoming week, rose +3.6% at an annual rate of 1,712,000, above expectations for 1,661,000 units and the upwardly revised 1,653,000 unit pace in October.
- The November advance estimate for Retail Sales rose +0.3%, missing expectations for a +0.8% increase and far below October’s upwardly adjusted +1.8% rise. Sales ex-autos also gained +0.3%, under expectations for +0.9% and October’s upwardly adjusted +1.8% rise. Sales of motor vehicles, electronics, and appliances, as well as health and personal care all fell, while non-store retail sales—including online activity—were flat. Sales rose at gasoline stations, clothing stores, and building material and supplies dealers.
- The Empire Manufacturing Index, a measure of activity in the New York region, moved further into expansion (a reading above zero) rising to 31.9 in December from 30.9 in November, easily beating expectations for a decrease to 25.0.
• The December Kansas City Fed Manufacturing Activity Index was unchanged at 24.0, slightly below expectations of an increase to 25.0, but still comfortably in the expansion (a reading above zero). - Weekly unemployment claims rose to 260,000, above expectations of 195,000. Continuing claims fell 154,000 to 1,845,000, a new post-pandemic low.
The Week Ahead
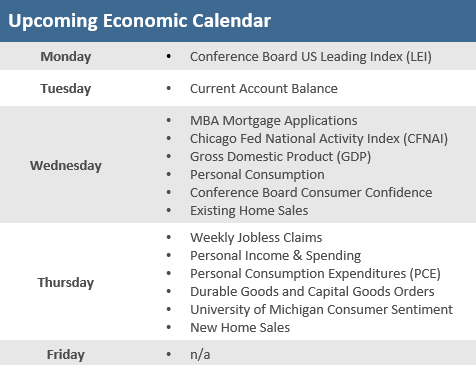
The holiday-shortened week, there are no releases on Friday, December 24, means another week of heavy releases on Wednesday and Thursday. Thursday brings the release of durable goods orders, which are rebounding impressively. The core figure, which excludes the more volatile defense and aircraft orders, is indicating a positive outlook for capital expenditure in the first half of 2022 while robust personal income numbers should allow consumers to continue spending aggressively.
Did You Know?
TAXES — The top 3% of US taxpayers in tax year 2019 reported at least $291,384 of adjusted gross income (AGI) but paid 52.10% of all federal income tax. The 97% of taxpayers who reported less than $291,384 of AGI paid the remaining 47.90% of federal income tax that was collected in tax year 2019 (source: IRS, BTN Research).
ABOVE THEM ALL — A year ago (12/21/20), Barron’s published the year-end 2021 forecast for the S&P 500 made by 10 Wall Street strategists. The 10 predictions ranged from a low of 3800 to a high of 4400. The index’s 12/31/20 actual close was 3756. The S&P 500 closed last Friday 12/17/21 at 4621 (source: Barron’s, BTN Research).
AT THE HIGH END — A year ago (12/21/20), Barron’s published the year-end 2021 forecast for the closing yield on the 10-year Treasury note made by 10 Wall Street strategists. The 10 predictions ranged from a low of 1.00% to a high of 1.50%. The 10-year note’s actual yield close on 12/31/20 was 0.913%. The yield on the 10-year Treasury note closed last Friday 12/17/21 at 1.377% (source: Barron’s, BTN Research).
This Week in History
This past week in 1903, the airplane age was born at 10:35 a.m., when Orville Wright headed into a 27-mph twisting wind and flew roughly 10 feet above the frigid sand dunes of Kitty Hawk, N.C., covering a distance of about 120 feet in 12 seconds (source: The Wall Street Journal).
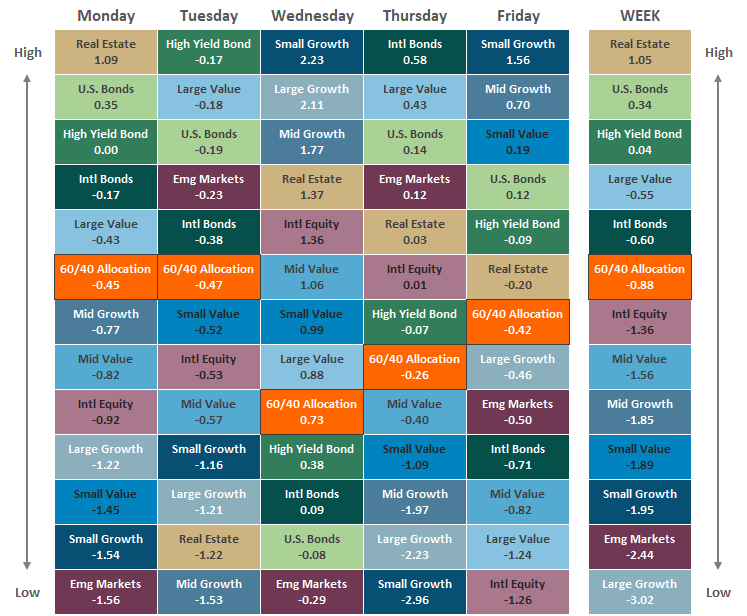
Asset Class Performance
The Importance of Diversification. Diversification mitigates the risk of relying on any single investment and offers a host of long-term benefits, such as lowering portfolio volatility, improving risk-adjusted returns, and helping investments to compound more effectively.
Source: Bloomberg. Asset‐class performance is presented by using market returns from an exchange‐traded fund (ETF) proxy that best represents its respective broad asset class. Returns shown are net of fund fees for and do not necessarily represent the performance of specific mutual funds and/or exchange-traded funds recommended by The Retirement Planning Group. The performance of those funds may be substantially different than the performance of the broad asset classes and to proxy ETFs represented here. U.S. Bonds (iShares Core U.S. Aggregate Bond ETF); High‐Yield Bond (iShares iBoxx $ High Yield Corporate Bond ETF); Intl Bonds (SPDR® Bloomberg Barclays International Corporate Bond ETF); Large Growth (iShares Russell 1000 Growth ETF); Large Value (iShares Russell 1000 Value ETF); Mid Growth (iShares Russell Mid-Cap Growth ETF); Mid Value (iShares Russell Mid-Cap Value ETF); Small Growth (iShares Russell 2000 Growth ETF); Small Value (iShares Russell 2000 Value ETF); Intl Equity (iShares MSCI EAFE ETF); Emg Markets (iShares MSCI Emerging Markets ETF); and Real Estate (iShares U.S. Real Estate ETF). The return displayed as “Allocation” is a weighted average of the ETF proxies shown as represented by: 30% U.S. Bonds, 5% International Bonds, 5% High Yield Bonds, 10% Large Growth, 10% Large Value, 4% Mid Growth, 4% Mid Value, 2% Small Growth, 2% Small Value, 18% International Stock, 7% Emerging Markets, 3% Real Estate.
Chris Bouffard is CIO of The Retirement Planning Group (TRPG), a Registered Investment Adviser. He has oversight of investments for the advisory services offered through TRPG.
Disclaimer: Information provided is for educational purposes only and does not constitute investment, legal or tax advice. All examples are hypothetical and for illustrative purposes only. Past performance of any market results is no assurance of future performance. The information contained herein has been obtained from sources deemed reliable but is not guaranteed. Please contact TRPG for more complete information based on your personal circumstances and to obtain personal individual investment advice.

