Quick Takes
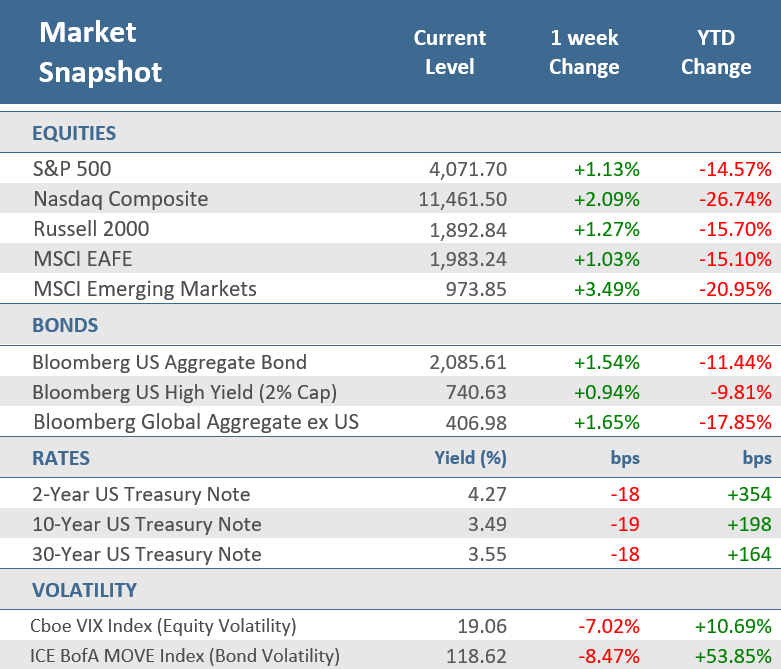
- U.S. indexes stocks rallied for a second straight week, the first back-to-back weekly gains for the major indexes since October. As with the prior week’s rally, the recent week’s strength was fueled by news that the Fed will slow the pace of rate hikes. The S&P 500 advanced +1.1%, the Nasdaq Composite rose +2.1%, and the Russell 2000 was up +1.3%.
- For the week the 10-year Treasury yield fell another -19 basis points to end the week at 3.49% and the 2-year Treasury yield dropped -18 basis points to finish at 4.27%. The falling yields helped the Bloomberg U.S. Aggregate Bond Index advance +1.5% for the week and the Bloomberg Global Aggregate Bond Index ex U.S. was up +1.7%.
- A Wednesday afternoon speech from Fed Chair Jerome Powell sent markets flying after he confirmed that the central bank will slow the pace of rate hikes, saying “It makes sense to moderate the pace of our rate increases as we approach the level of restraint that will be sufficient to bring inflation down.”
Stocks and bonds rally for a second straight week
U.S. stocks and bonds posted solid gains for the second week in a row, the first back-to-back weekly gains for the major indexes since October. The S&P 500 advanced +1.1%, the Nasdaq Composite rose +2.1%, and the Russell 2000 was up +1.3%. The gains weren’t as robust as last week when all 11 S&P 500 sectors were positive. This week did see Energy and Financials in the red, but the other sectors had decent gains led by Communication Services which were up +3.5% for the week. Developed market stocks continue to benefit from the recent pullback in the U.S. dollar as the MSCI EAFE Index gained +1.0% while Emerging Market stocks rebounded from the prior week’s loss with a +3.5% rally. The bulk of the gains came on Wednesday afternoon following a speech from Fed Chairman Jerome Powell that sent markets flying after he confirmed that the central bank will begin to slow the pace of its aggressive interest rate hikes, saying “It makes sense to moderate the pace of our rate increases as we approach the level of restraint that will be sufficient to bring inflation down.” Powell did caution that the Fed may keep policy restrictive for a long time before it ends its inflation fight. By the end of Wednesday’s trading, the Nasdaq had jumped +4.4%, while the S&P 500 finished the day up +3.1%.
Treasury yields eased further on the dovish Fed news but did rise on Friday’s stronger than expected November employment report. Nonfarm payrolls came in much higher than economists’ forecasts. Low unemployment and wage gains are helping fuel consumer spending—and contributing to inflation that’s close to a four-decade high. The strong November employment report keeps the Fed on track to raise interest rates by a half percentage point on December 14. Still, for the week the 10-year Treasury yield fell another -19 basis points to end the week at 3.49% and the 2-year Treasury yield dropped -18 basis points to finish at 4.27%. The falling yields helped the Bloomberg U.S. Aggregate Bond Index advance +1.5% for the week and the Bloomberg Global Aggregate Bond Index ex U.S. was up +1.7%.
Other economic data during the week was less than stellar. Reads on manufacturing activity were less optimistic, with the ISM Manufacturing Index falling into contraction territory for the first time since May 2020, and regional manufacturing reports disappointing. The Fed released its Beige Book—an anecdotal look at national business activity used by Fed officials to prep for the next monetary policy meeting. The report showed a slight weakening in overall economic activity from its prior report, with five Fed Districts reporting slight or modest gains and the others experiencing either no change or slight-to-moderate declines. Many Districts noted that interest rates and inflation continued to weigh on activity while expressing heightened uncertainty and increased pessimism surrounding the outlook. Regarding jobs, the report showed that employment grew modestly in most Districts, but that the labor market remains tight.
Chart of the Week
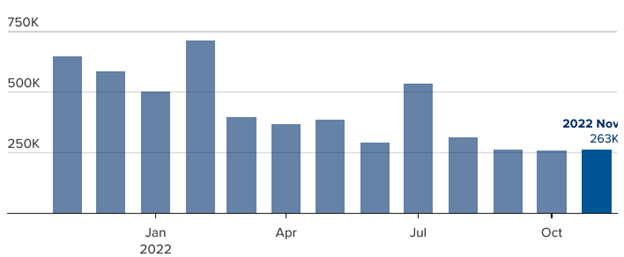
Job growth was much better than expected in November despite the Federal Reserve’s aggressive efforts to slow the labor market and slow inflation. Nonfarm Payrolls rose by 263,000 jobs for the month of November, well above expectations for a 200,000 rise, while October’s figure was upwardly revised to an increase of 284,000 from the initially reported 261,000. The Unemployment Rate remained at October’s 3.7% level which was in line with forecasts. The Underemployment Rate—including total unemployed and those employed part time for economic reasons, along with people who are marginally attached to the labor force—decreased to 6.7% from 6.8% the prior month. Average Hourly Earnings were up +0.6% for the month, above expectations for a +0.3% rise and above October’s upwardly revised +0.5% rise. Year-over-year, wages were +5.1% higher, above expectations of +4.6%, but below October’s upwardly revised +4.9% rise. Average Weekly Hours worked slipped to 34.4 from 34.5 in October where it was expected to remain. The Labor Force Participation Rate dipped to 62.1% from October’s unrevised 62.2% figure, where it was expected to remain.
November job growth tops forecasts
U.S. monthly job creation in the last year
Source: Bureau of Labor Statistics via FRED, CNBC.
Economic Review
- The second look (of three) at Q3 Gross Domestic Product (GDP), the broadest measure of U.S. economic output, showed a +2.9% quarter-over-quarter annualized rate of growth, slightly above expectations of +2.8% after the first report of a +2.6% increase. Personal Consumption rose +1.7%, above expectations of +1.6% and the prior reading of +1.4%. On inflation, the GDP Price Index rose +4.3%, stronger than expectations for it to remain at the prior read’s +4.1% gain. The Core PCE Price Index, which excludes food and energy, marked a +4.6% growth rate, also above expectations to match the prior reading (a +4.5% rise).
- The November Institute for Supply Management (ISM) Manufacturing Purchasing Managers Index (PMI) fell into contraction territory (a reading below 50), declining to 49.0 from 50.2 the prior month, and below expectations for a decline to 49.7. It was the first time the manufacturing sector has contracted since May 2020 as new orders moved further below 50, production growth slowed, and employment dropped back into contraction territory. Additionally, inventories decelerated, and supplier deliveries improved modestly. Inflation pressures continued to cool, with the Prices Index falling -3.6 points to 43.0 from 46.6.
- The final read on the November S&P Global U.S. Manufacturing PMI Index was unexpectedly revised slightly higher but remained in contraction territory (a reading below 50). The index was adjusted to 47.7 from the preliminarily reported 47.6 figure, where it was expected to remain.
- Preliminary Wholesale Inventories rose +0.8% for the month of October, above expectations of a +0.5% gain and September’s unrevised +0.6% increase.
- The November Chicago PMI unexpectedly fell further into contraction territory (a reading below 50), dropping to 37.2—the lowest since May 2020—from 45.2 in October, far below expectations for a slight gain to 47.0. New orders and production fell at faster paces, accelerating their contraction, and employment fell at a slower pace but remains in contraction. Prices paid rose at a slower pace but continued to expand, supplier delivery times declined, and the contraction in order backlogs accelerated.
- The November Dallas Fed Manufacturing Index beat expectations but remained solidly in contraction territory (a reading below zero). The index rose to -14.4 from -19.4 in October, well above expectations for a decline to -21.0. The unexpected improvement came from accelerating employment and prices received for finished goods increased. However, the contraction in new orders and the growth rate of orders continued, and shipments dropped into contraction territory. Prices paid for raw materials remained elevated but did decelerate.
- The Conference Board’s Consumer Confidence Index fell to 100.2 in November from October’s downwardly revised 102.2 but was above expectations of 99.8. The Expectations Index component of business conditions for the next six months decreased to 75.4 from 77.9 in October, while the Present Situation Index portion of the survey declined to 137.4 from 138.7 in the previous month. On employment, the labor differential—consumers’ appraisal of jobs being “plentiful” minus being “hard to get”—increased to 32.8 from 31.8 in October. “Consumers’ expectations regarding the short-term outlook remained gloomy. Indeed, the Expectations Index is below a reading of 80, which suggests the likelihood of a recession remains elevated,” said Lynn Franco, The Conference Board’s senior director of economic indicators.
- October Personal Income rose +0.7% beating expectations for it to match September’s unrevised +0.4% gain. Personal Spending increased +0.8%, in line with expectations and above the prior month’s unadjusted +0.6% rise. The September Savings Rate as a percentage of disposable income was +2.3%, down from September’s downwardly revised +2.4% rate.
- The October PCE Deflator rose +0.3% for the month, below expectations of +0.4% and in line with September’s unadjusted gain. Year-over-year, the deflator was +6.0% higher, in line with expectations but down from the prior month’s upwardly revised +6.3%. Excluding food and energy, the Core PCE Price Index was up +0.2%, below the expectation of +0.3% and September’s +0.5%. For the year, the Core PCE Price Index was +5.0% higher, matching expectations but lower than September’s upwardly revised +5.2% annual gain
- The Labor Department’s Job Openings and Labor Turnover Survey (JOLTS), a measure of unmet demand for labor, declined to 10.33 million jobs available to be filled in October, beating expectations for 10.25 million but down from September’s downwardly revised 10.69 million. The Hiring Rate was 3.9%, down from 4.0% in September, and total separations—including quits, layoffs, discharges, and other separations—remained at September’s 3.7% rate. The quit rate for October dipped to 2.6% from 2.7% the prior month.
- The September S&P CoreLogic Case-Shiller Home Price Index fell -0.76% for the month as high mortgage rates have eroded demand. Monthly house prices were the first negative in July, falling -0.55%, the first monthly drop since late 2018, and then fell further in August, down -0.91%. Year-over-year, home prices are up +10.65% from September 2021, a slower pace than the +12.9% recorded in August, and the fifth straight month of annual deceleration.
- October Pending Home Sales fell -4.6%, better than expectations for a -5.3% decrease and September’s upwardly revised -8.7% drop. Year-over-year, sales tumbled -36.7%, following September’s upwardly revised -29.3% fall. This is the fifth straight month of sales declines (and 11th of the last 12 months) and the year-over-year drop is the biggest annual drop ever. Pending home sales reflect contract signings and are a gauge of the pipeline of existing home sales, as properties typically go under contract a month or two before they are sold.
- October Construction Spending was down -0.3% for the month, worse than expectations for a -0.2% decline and below September’s downwardly revised +0.1% gain. Residential and non-residential spending both decreased -0.3%.
- The weekly MBA Mortgage Application Index fell -0.8% from the prior week’s +2.2% rise as the Refinance Index dropped -12.9% while the Purchase Index was up +3.8% for the week. The decrease came as the average 30-year mortgage rate fell 18 bps to 6.49%, which is up 3.18 percentage points versus a year ago.
- Weekly Initial Jobless Claims fell by 15,000 to 225,000 for the week ended November 26, below expectations for 235,000, and the prior week’s upwardly revised 241,000. Continuing Claims for the week ended November 19 rose by 57,000 to 1,608,000, higher than expectations of 1,570,000.
The Week Ahead
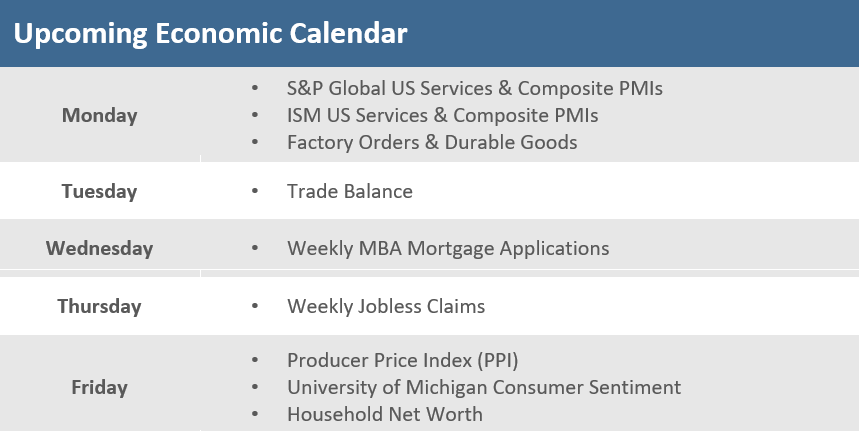
Data in the upcoming week should provide further evidence that goods prices are rapidly decelerating. Bloomberg expects Friday’s Producer Price Index (PPI) will show both headline and core prices for producers running at a pace nearly consistent with the Fed’s 2% inflation target. Near-term inflation expectations will come in the University of Michigan Consumer Sentiment report, also on Friday, and will likely be down for November as gasoline prices have been dropping on weakening global growth. Service sector PMIs from both S&P Global and ISM will come on Monday and are expected to show continued growth but at a slower pace.
Did You Know?
CHICKEN LITTLE – Prices for chicken breasts in the U.S. have plunged about -70% since the first week of June, according to market research firm Urner Barry. According to chicken-industry analysts and executives, wings and tenders have gotten cheaper, too, as poultry companies have increased production while demand from restaurants and supermarkets has remained flat (source: Urner Barry, The Wall Street Journal).
EARLY RETIREMENT – A new study found that late-life disabilities force early retirement. 1 in 4 workers who are still healthy in their mid-50s will experience a disability in the next few years that will make working more difficult. Nearly 75% of workers who experienced a new disability in their late 50s or early 60s left the labor force before their full retirement age. Among the people who didn’t have a disability, only 33% stopped working (source: Center for Retirement Research at Boston College, MFS).
THE YEAR AFTER – The S&P 500 has achieved an average annual total return of +14.8% in the calendar year after each of the 16 down years between 1946 and 2021. That result is +3.5% greater than the long-term average annual return of +11.3% for the index in the years 1946 through June 13, 2022 (source: MFS).
This Week in History
GLOBE TROTTING – On November 29, 1912, John Marks Templeton was born in Winchester, Tennessee, to Vella Handly and Harvey Maxwell Templeton, a lawyer, and cotton-gin operator. John went on to found the Templeton Growth Fund, essentially inventing the discipline of global investing (source: The Wall Street Journal).
Asset Class Performance
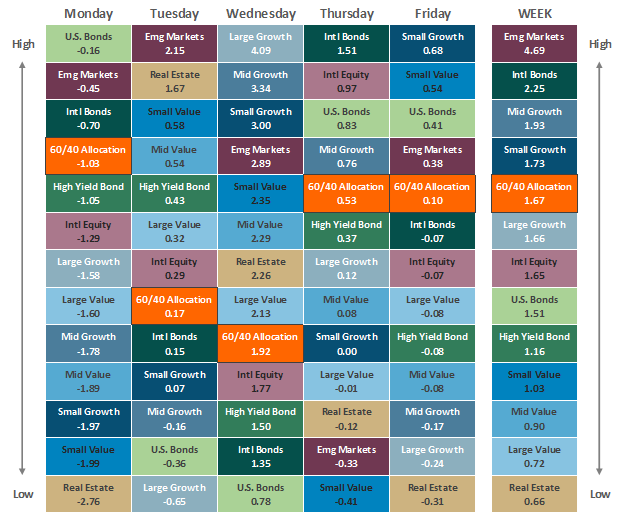
The Importance of Diversification. Diversification mitigates the risk of relying on any single investment and offers a host of long-term benefits, such as lowering portfolio volatility, improving risk-adjusted returns, and helping investments to compound more effectively.
Source: Bloomberg.
Asset‐class performance is presented by using market returns from an exchange‐traded fund (ETF) proxy that best represents its respective broad asset class. Returns shown are net of fund fees for and do not necessarily represent performance of specific mutual funds and/or exchange-traded funds recommended by The Retirement Planning Group. The performance of those funds may be substantially different than the performance of the broad asset classes and to proxy ETFs represented here. U.S. Bonds (iShares Core U.S. Aggregate Bond ETF); High‐Yield Bond (iShares iBoxx $ High Yield Corporate Bond ETF); Intl Bonds (SPDR® Bloomberg Barclays International Corporate Bond ETF); Large Growth (iShares Russell 1000 Growth ETF); Large Value (iShares Russell 1000 Value ETF); Mid Growth (iShares Russell Mid-Cap Growth ETF); Mid Value (iShares Russell Mid-Cap Value ETF); Small Growth (iShares Russell 2000 Growth ETF); Small Value (iShares Russell 2000 Value ETF); Intl Equity (iShares MSCI EAFE ETF); Emg Markets (iShares MSCI Emerging Markets ETF); and Real Estate (iShares U.S. Real Estate ETF). The return displayed as “Allocation” is a weighted average of the ETF proxies shown as represented by: 30% U.S. Bonds, 5% International Bonds, 5% High Yield Bonds, 10% Large Growth, 10% Large Value, 4% Mid Growth, 4% Mid Value, 2% Small Growth, 2% Small Value, 18% International Stock, 7% Emerging Markets, 3% Real Estate.
* The term basis points (bps) refers to a common unit of measure for interest rates and other percentages in finance. One basis point is equal to 0.01%. Bond prices and bond yields are inversely related. As the price of a bond goes up, the yield decreases.


