Quick Takes
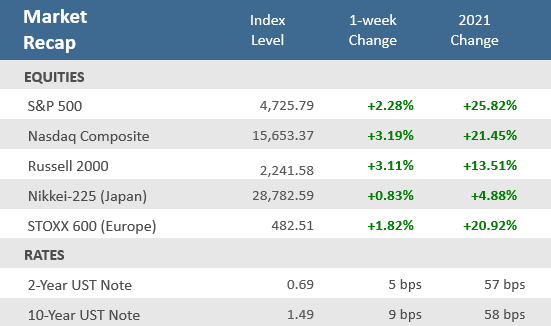
- Stocks began the week with sharp losses on Monday, but then rallied the final three days of the holiday-shortened week. The S&P 500 gained +2.3% for the week, closing at a new all-time high – the 68th all-time high in 2021.
- US Home prices are at a record high median price of $416,900 and have risen +19% over the last year, the highest rate of increase ever. Rents in the US are up +18%, also the highest increase ever observed.
- The Federal Reserve’s favorite inflation measure, the Core Personal Consumption Expenditure price index, rose +4.7% in November, more the twice the rate of the Fed’s 2% target inflation rate.
Santa Rally finally comes after big drop on Monday
The week began like the prior week ended – on a big down note. Major U.S. stock indexes fell -1.0% to -1.5% on continued fears of an Omicron-induced economic slowdown and news that Joe Manchin, Democrat Senator from West Virginia, would oppose his party’s nearly $2 trillion spending bill. But Tuesday brought a turnaround that broke a three-day losing streak and began a three-day winning streak to head into the Christmas weekend. Data from South Africa further validated evidence that the Omicron variant was much less severe than prior COVID waves. News that the FDA authorized Pfizer’s Paxlovid pill for at-home treatment of mild-to-moderate COVID-19 cases in high-risk patients also helped temper investor anxieties. As a result, stocks rose for the final three days of the holiday-shortened week (U.S. markets were closed Friday in observation of Christmas). The S&P 500 index was up +2.3% for the week and closed at a new record high. The Nasdaq was up +3.2%, with growth-oriented sectors like Consumer Discretionary and Information Technology leading the way. The small-cap Russell 2000 Index was up +3.1%. The rally helped tamp down the choppiness of the prior two weeks, with the Cboe Volatility Index (VIX) dropping back under 18 from 21.6 the last Friday. The yield on the 10-year U.S. Treasury Note rose nine basis points (0.09%) to 1.49%, helping the Treasury yield curve to steepen after flattening the prior week after the Fed announced that it will speed up the pace of its tapering of monthly bond purchases, and projected the possibility of three rate hikes in 2022.
Chart of the Week
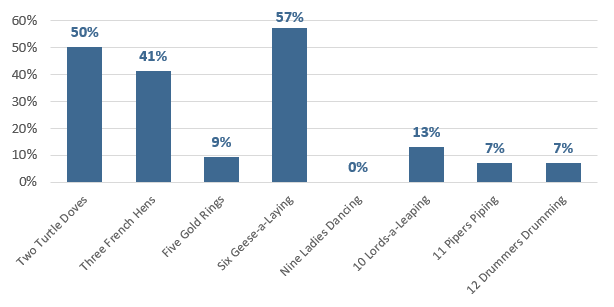
Inflation has been a key theme in 2021, especially as the year comes to a close. In fact, the previous Chart of the Week featured the most significant increase ever for the Producer Price Index (PPI). With the Christmas-shortened week, it seems appropriate to feature both Christmas and inflation. J.P. Morgan brought us this chart that looks at the PNC Christmas Price Index, in which PNC applies price analysis to the gift items in The 12 Days of Christmas song. With the pandemic and lockdowns of the index last year, the prices here are compared to 2019 pre-COVID prices. What is striking is how much poultry prices increased. Turtle Doves, French Hens, and Geese are up a whopping 41-57% since 2019. The next most significant component was a fraction of that, but at a 13% increase, 10 Lords-a-Leaping shows the wage hike pressures most business owners are dealing with (though one must question why nine Ladies Dancing saw no wage increase). Live music fans must be happy it has returned to most parts of the country – and at a relatively modest price increase. Piping Pipers and Drumming Drummers are up just 7% since 2019. No matter the price, The Retirement Planning Group wishes everybody a very Merry Christmas and a safe, festive New Year!
Bha-Humbug! Inflation is for the Birds… Literally
PNC Christmas Price Index, % price change vs. 2019 levels
Source: J.P. Morgan.
Economic Review
- The Conference Board, a private research group, said its Leading Economic Index (LEI) was up +1.1% in November from October, above estimates for a +1.0% gain and October’s unrevised +0.9% increase. The LEI was positive for the ninth-straight month due largely to the positive net contribution from jobless claims.
- The December Conference Board Consumer Confidence Index rose to 115.8 in December from an upwardly revised 111.9 in November, and well ahead of expectations for 111.0. The overall index got a boost from the Expectations Index of business conditions for the next six months portion of the index, which jumped to 96.9 from November’s 90.2 level, while the Present Situation Index portion of the survey was nearly unchanged from the previous month. The survey found that concerns about inflation declined from a 13-year high but consumer remain anxious. COVID and Omicron concerns also declined but concerns persist. as did concerns about Covid-19. Expectations about short-term growth prospects improved, setting the stage for continued growth in early 2022. The proportion of consumers planning to purchase homes, automobiles, major appliances, and vacations over the next six months all increased.
- November Existing Home Sales increased +1.9% to an annual rate of 6.46 million units, below expectation of 6.53 million units, but ahead of October’s unrevised 6.34 million rate. Still November was the highest seasonally adjusted annual rate since January and puts existing home sales on track for their strongest year since 2006. Sales were higher in three of the four major U.S. regions, while the fourth held steady. Each region fell on a year-over-year basis though. Sales of single-family homes were up for the month but flat compared to a year ago. The median existing home price was up +13.1% from a year ago to $353,900, marking the 117th straight month of annual gains. Unsold inventory was at a 2.1-months pace at the current sales rate, down from the from the 2.4-months pace a year earlier.
- November New Home Sales increased +12.4% from the prior month to an annual rate of 744,000 units, a seven-month high, but below forecasts of 770,000 units, and compared to October’s downwardly revised 662,000-unit level. But on a year-over-year basis New Home Sales were down -14%, well below forecasts. October’s sales numbers were revised down to the lowest level since the start of the pandemic. The median home price jumped +18.8% from last year to a record $416,900. New home inventory rose to 6.5 months from October’s level of a 6.3-months supply. Sales were up from the prior month in all regions except in the Midwest, with a sharp gain seen in the West region.
- The final measure (of three) of Q3 Gross Domestic Product (GDP), the broadest measure of U.S. economic output, showed a quarter-over-quarter annualized rate of growth of +2.3%, above forecasts for it to remain at the +2.1% growth rate posted in the second estimate. Q2’s figure was unadjusted at a +6.7% increase. Personal Consumption was revised to a +2.0% rise for Q3 from the previous estimate of a +1.7% gain and versus expectations to be unrevised. Q2 personal consumption remained unadjusted at a +12.0% gain. On the inflation front, the GDP Price Index was revised to a +6.0% gain compared to expectations for it to remain at the prior +5.9% increase, while the Core PCE Index, which excludes food and energy, was also upwardly revised to a +4.6% gain from the previous +4.5% rise.
- The November PCE Deflator rose +0.6%, in line with expectations, but below October’s upwardly adjusted +0.7% gain. Compared to last year, the deflator was +5.7% higher, matching expectations and above the prior month’s upwardly adjusted +5.1% increase. Excluding food and energy, the Core PEC Price Index rose +0.5% m/m, beating expectations of a +0.4% rise, and matching October’s rise. The index was +4.7% higher than a year ago, above expectations of 4.5%, and October’s upwardly revised 4+.2% rise.
- November preliminary Durable Goods Orders rose +2.5% month-over-month, well above expectations for +1.8% and October’s +0.1% rise (revised up from an initial -0.4% decline). Ex-transportation, orders were up +0.8% over the prior months, above expectations for a +0.5% gain and October’s downwardly revised +0.3% gain. Capital Goods Orders excluding aircraft, considered a proxy for business spending, decreased -0.1%, compared to forecasts for a +0.6% rise, and the prior month’s upwardly revised +0.9% increase.
- Personal Income rose +0.4% in November from October, matching expectations but a bit below October’s unrevised 0.5% gain. Personal Spending rose +0.6%, also in line with expectations, and above the prior month’s upwardly adjusted +1.4% gain. The November savings rate as a percentage of disposable income was 6.9%.
- The December final University of Michigan Consumer Sentiment Index was revised higher to 70.6, compared to expectations for it to be unadjusted at its preliminary reading of 70.4, and November’s 67.4 level. The upward revision came as the expectations component of the survey was revised higher, more than offsetting a slight decline in the current conditions portion.
- Weekly unemployment claims fell to 205,000, in line with expectations. Continuing claims fell 49,000 to 1,919,750.
The Week Ahead
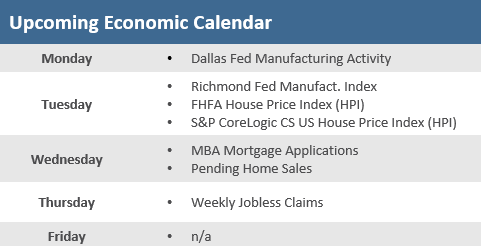
It’s another holiday-shortened week, for economic data anyway (the stock market is still open), with News Years day observed on Friday so no releases on December 31. As such the economic calendar for the last week of 2021 will be light, with a couple of regional manufacturing reports, as well as pending home sales and weekly initial jobless claims. Overseas, China manufacturing and non-manufacturing PMIs will be watched as a gauge of China’s economic recovery.
Did You Know?
UP AND DOWN — The nation’s personal savings rate, which soared during the early months of the pandemic, has now fallen back to its pre-pandemic levels. The savings rate was 7.5% in November 2019, rose to 8% in April 2020, and now has come back to 6.9% as of November 2021 (source: Bureau of Economic Analysis, Bloomberg, BTN Research).
STOCKS AND HIGH INFLATION — In the last 70 years (1951-2020), inflation as measured by the “Consumer Price Index” (CPI) was been at least +5% in 12 different years, most recently in 1990. The S&P 500 has been equally split over the 12 high-inflation years, advancing in 6 years and falling in 6 years (on a total return basis). The average total return for the S&P 500 over all 12 years is a gain of just +3.2% (source: BTN Research).
REALLY LOW — Inflation, as measured by the “Consumer Price Index” (CPI), was up +1.4% for 2020. For the decade of the 2010s (1/01/2010 through 12/31/2019), inflation was up just +1.8% per year, the lowest decade of inflation in the USA since the 1930s. By comparison, the decade of the 1970s (1/01/1970 through 12/31/1979) suffered +7.4% annual inflation (source: Department of Labor, BTN Research).
This Week in History
On December 22, 1973, during a meeting in Tehran, the oil ministers of OPEC’s six Persian Gulf member countries said they would unilaterally raise the price of crude oil to $7 per barrel—and that it would go up again, to $11.65, on Jan. 1, 1974. In two-and-a-half months, OPEC had raised the price of oil by 128% (source: The Wall Street Journal).
Asset Class Performance
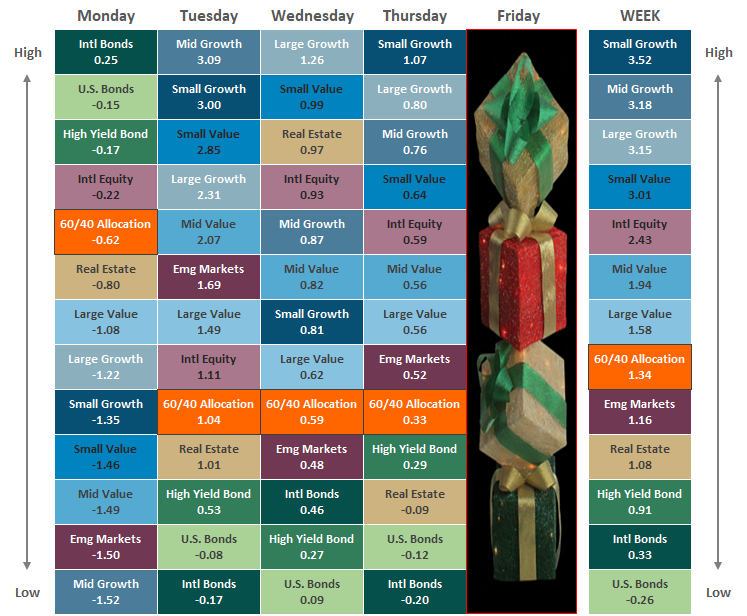
The Importance of Diversification. Diversification mitigates the risk of relying on any single investment and offers a host of long-term benefits, such as lowering portfolio volatility, improving risk-adjusted returns, and helping investments to compound more effectively.
Source: Bloomberg. Asset‐class performance is presented by using market returns from an exchange‐traded fund (ETF) proxy that best represents its respective broad asset class. Returns shown are net of fund fees for and do not necessarily represent the performance of specific mutual funds and/or exchange-traded funds recommended by The Retirement Planning Group. The performance of those funds may be substantially different than the performance of the broad asset classes and to proxy ETFs represented here. U.S. Bonds (iShares Core U.S. Aggregate Bond ETF); High‐Yield Bond (iShares iBoxx $ High Yield Corporate Bond ETF); Intl Bonds (SPDR® Bloomberg Barclays International Corporate Bond ETF); Large Growth (iShares Russell 1000 Growth ETF); Large Value (iShares Russell 1000 Value ETF); Mid Growth (iShares Russell Mid-Cap Growth ETF); Mid Value (iShares Russell Mid-Cap Value ETF); Small Growth (iShares Russell 2000 Growth ETF); Small Value (iShares Russell 2000 Value ETF); Intl Equity (iShares MSCI EAFE ETF); Emg Markets (iShares MSCI Emerging Markets ETF); and Real Estate (iShares U.S. Real Estate ETF). The return displayed as “Allocation” is a weighted average of the ETF proxies shown as represented by: 30% U.S. Bonds, 5% International Bonds, 5% High Yield Bonds, 10% Large Growth, 10% Large Value, 4% Mid Growth, 4% Mid Value, 2% Small Growth, 2% Small Value, 18% International Stock, 7% Emerging Markets, 3% Real Estate.
Chris Bouffard is CIO of The Retirement Planning Group (TRPG), a Registered Investment Adviser. He has oversight of investments for the advisory services offered through TRPG.
Disclaimer: Information provided is for educational purposes only and does not constitute investment, legal or tax advice. All examples are hypothetical and for illustrative purposes only. Past performance of any market results is no assurance of future performance. The information contained herein has been obtained from sources deemed reliable but is not guaranteed. Please contact TRPG for more complete information based on your personal circumstances and to obtain personal individual investment advice.


