Quick Takes
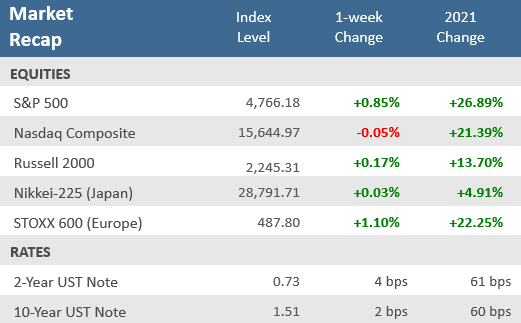
- In light holiday trading, stocks were mostly up. The exception was the Nasdaq Composite which was barely down with a -0.1% loss. The S&P 500 index finished the last week of the year with a +0.9% gain, giving the index a +26.9% return for 2021.
- Although treasury yields were up slightly for the week, the Bloomberg U.S. Aggregate Bond Index was able to rise +0.2% in the final week of 2021. However, the bond index was down -1.5% for the full year, its first decline since 2013.
- Home prices continue to rise, with both the S&P CoreLogic Case-Shiller and the Federal Housing Finance Agency (FHFA) house price indexes gaining in October; up +18 and 17% from October 2020, respectively.
Stocks mostly up in the final week of trading in 2021
In the final week of trading for 2021, the S&P 500 increased +0.9%, the Dow Jones Industrial Average was up +1.1%, and the small-cap Russell 2000 Index was up +0.2%, but the Nasdaq Composite was down slightly, dipping -0.1% lower. For the year, most global stocks posted solid gains for a third consecutive time, with the S&P 500 up +26.7%, the Dow up +18.7%, the Russell 2000 up +13.7% and, the Nasdaq Composite up +21.4%. Most developed markets indexes were up nicely in 2021 as well. Yields were up slightly for the week, with the US 10-year Treasury yield rising two basis points (+0.02%), but the Bloomberg U.S. Aggregate Bond Index still managed to eke out a slight gain, rising +0.2%. However, the benchmark bond index was down -1.5% for the year, its first calendar year loss since 2013 and just its fourth negative year since the index’s inception in 1976. With the week packed between the Christmas and New Year’s holidays, trading volume was low, and the Cboe VIX Volatility Index remained under 18 for the second straight week.
Chart of the Week
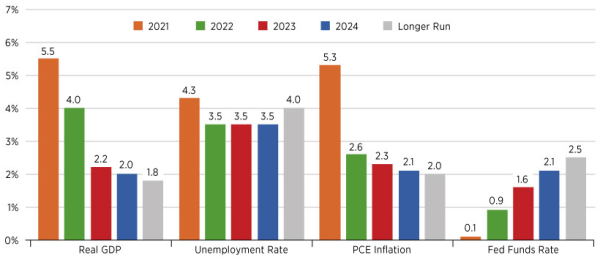
The U.S. economy continues to recover from widespread disruptions in the economy and markets spawned by the pandemic. But the strong rebound in real gross domestic product (GDP) growth in 2021 has been accompanied by high inflation, which surprised most forecasters and Federal Open Market Committee (FOMC) participants. Headline and core inflation rates for the personal consumption expenditures price index will likely end 2021 at their highest in 30 years or more. The U.S. is expected to post strong GDP growth in 2022. Currently the FOMC projects 2022 inflation to run at 2.6%, down considerably from the 5.3% in 2021. However, if higher inflation persists and erodes household purchasing power further, that could put economic growth at risk.
Inflation Remains Wild Card in U.S. GDP Outlook for 2022
The FOMC’s December 2021 Economic Projections
Source: Summary of Economic Projections, Federal Reserve Bank of St. Louis.
NOTES: Projections are the median projections of the Federal Open Market Committee (FOMC) participants. The projections for real gross domestic product (GDP) growth and inflation are the percentage change from the fourth quarter of the previous year to the fourth quarter of the indicated year. Inflation is measured by the personal consumption expenditures chain-price index. The projection for the unemployment rate is the average for the fourth quarter of year indicated. The federal funds rate is the projected appropriate path.
Economic Review
- The December Dallas Fed Manufacturing Index unexpectedly declined but remained in expansion territory (a reading above zero), falling to 8.1, down from 11.8 in November and well below forecasts of a rise to 13.5. On the contrary, the December Richmond Fed Manufacturing Index unexpectedly rose. The index, which measures business activity for the mid-Atlantic region, increased to 16, well above forecasts for 11, and above the 12 reported in November (reading above zero denote economic expansion).
- The 20-city composite S&P CoreLogic Case-Shiller Home Price Index was up a seasonally adjusted +0.92% in October compared to the prior month, slightly ahead forecasts for a +0.90% gain. On a year-over-year basis home prices were up +18.4%, slightly below estimates of an +18.5% rise. All 20 cities posted double-digit annual gains.
- The Federal Housing Finance Agency (FHFA) also released its U.S. House Price Index (HPI) for October. House prices rose +1.1% nationwide in October from the previous month, up from the unrevised +0.9% for September. House prices rose +17.4% from October 2020 to October 2021.
- Pending Home Sales fell -2.2% in November, far below expectations a +0.8% gain, and October’s unrevised +7.5% increase. Sales were up +0.2% year-over-year, following October’s unadjusted -4.7% fall. Pending home sales reflect contract signings and are a gauge of the pipeline of existing home sales.
- Weekly unemployment claims fell to 198,000, below expectations for 206,000, which was what the prior week’s upwardly revised level came in at. Continuing claims fell 140,000 to 1,716,000, a new pandemic low and well below forecasts for 1,859,500.
The Week Ahead
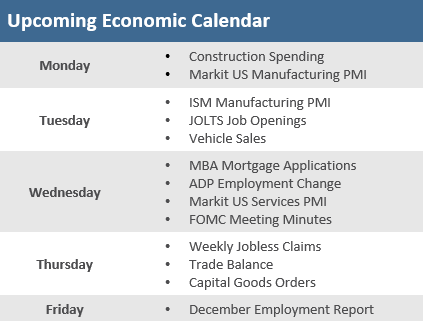
The first economic week of 2022 brings separate readings on Purchase Managers Indices (PMIs) from Markit and ISM. On Wednesday the Fed will deliver the minutes from its December monetary policy meeting that should provide some additional insight into its decision to pivot to accelerate the tapering of its asset purchase program and to potentially increase the number of rate hikes it delivers in 2022. Friday with bring the key December jobs report with updates on nonfarm payrolls and the unemployment rate.
Did You Know?
BANNER YEAR — The S&P closed the year at 4,766, up 27% for the year and just 30 points from its 70th record close reached on Wednesday, December 29. That’s still far above levels predicted by analysts in a January survey, in which the top projection was 4,400 and average of 22 estimates was 4,074. The 70 all-time highs in 2021 is the second most of any calendar year in history, trailing only the 77 all-times highs that occurred in 1995 (source: Bloomberg).
THREE-PEAT — The total return, including dividends, for the S&P 500 in 2021 was 28.7%. That marks the third consecutive year of double-digit gains, the longest such stretch since 1999. Over those last 3 years, the S&P 500 has more than doubled (+100%), on a total-return basis, its highest 3-year return since 1997-1999 (source: Bloomberg, Compound Capital).
GOOD NEWS, BAD NEWS — Bad news first… when the S&P 500 was up more than 25% in a calendar year it has never gained more the following year. The good news? The following year can still be really good. The index has returned at least 25% in 14 prior calendar years since 1950. It has been higher the subsequent year in all but two of those instances (86% of the time) by a healthy +9.2% average gain (median +11.8%) over those prior 14 occurrences (source: LPL Research, FactSet).
This Week in History
22 years ago, on December 31, 1999, traders braced for a potential disruption of the global financial system from the “Y2K bug” — fear that computers’ potential inability to handle dates beginning with 2000 rather than 1900, would create chaos in the world economy. A pileup of data errors in the programs that control the NYSE’s basic operations would potentially grind the entire stock market to a halt. The stock market closed at 1 p.m. on the final trading day of 1999, giving traders and NYSE officials a few extra hours to prepare for what could have been one of the largest disasters in financial market history. At the time, NYSE technicians has spent $30 million over the four years leading up to the turn of the century to rewrite and test software that otherwise might not have known how to handle the change. When trading resumed on January 3, 2000, the first session of the 21st century went off without any major hiccups. The S&P 500 was trading at 1,469.25 and the Dow Jones Industrial Average was trading at 11,497.12 (source: Benzinga).
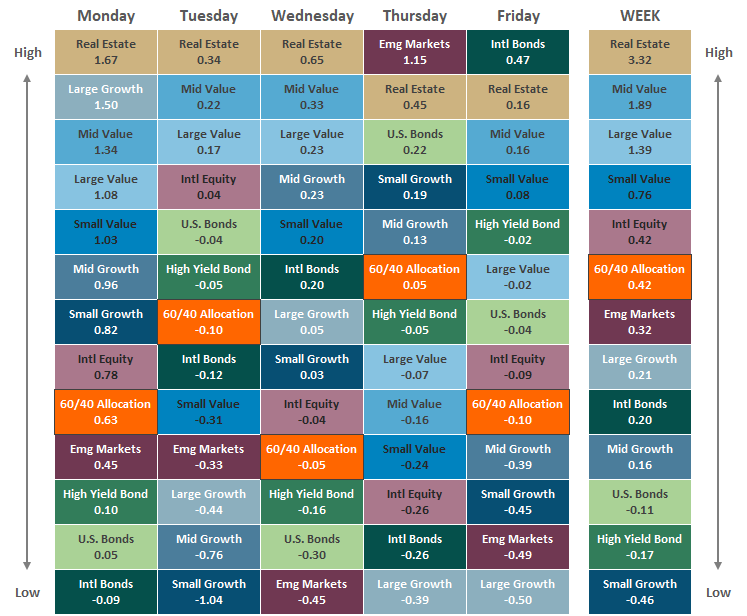
Asset Class Performance
The Importance of Diversification. Diversification mitigates the risk of relying on any single investment and offers a host of long-term benefits, such as lowering portfolio volatility, improving risk-adjusted returns, and helping investments to compound more effectively.
Source: Bloomberg. Asset‐class performance is presented by using market returns from an exchange‐traded fund (ETF) proxy that best represents its respective broad asset class. Returns shown are net of fund fees for and do not necessarily represent the performance of specific mutual funds and/or exchange-traded funds recommended by The Retirement Planning Group. The performance of those funds may be substantially different than the performance of the broad asset classes and to proxy ETFs represented here. U.S. Bonds (iShares Core U.S. Aggregate Bond ETF); High‐Yield Bond (iShares iBoxx $ High Yield Corporate Bond ETF); Intl Bonds (SPDR® Bloomberg Barclays International Corporate Bond ETF); Large Growth (iShares Russell 1000 Growth ETF); Large Value (iShares Russell 1000 Value ETF); Mid Growth (iShares Russell Mid-Cap Growth ETF); Mid Value (iShares Russell Mid-Cap Value ETF); Small Growth (iShares Russell 2000 Growth ETF); Small Value (iShares Russell 2000 Value ETF); Intl Equity (iShares MSCI EAFE ETF); Emg Markets (iShares MSCI Emerging Markets ETF); and Real Estate (iShares U.S. Real Estate ETF). The return displayed as “Allocation” is a weighted average of the ETF proxies shown as represented by: 30% U.S. Bonds, 5% International Bonds, 5% High Yield Bonds, 10% Large Growth, 10% Large Value, 4% Mid Growth, 4% Mid Value, 2% Small Growth, 2% Small Value, 18% International Stock, 7% Emerging Markets, 3% Real Estate.
Chris Bouffard is CIO of The Retirement Planning Group (TRPG), a Registered Investment Adviser. He has oversight of investments for the advisory services offered through TRPG.
Disclaimer: Information provided is for educational purposes only and does not constitute investment, legal or tax advice. All examples are hypothetical and for illustrative purposes only. Past performance of any market results is no assurance of future performance. The information contained herein has been obtained from sources deemed reliable but is not guaranteed. Please contact TRPG for more complete information based on your personal circumstances and to obtain personal individual investment advice.

