Quick Takes
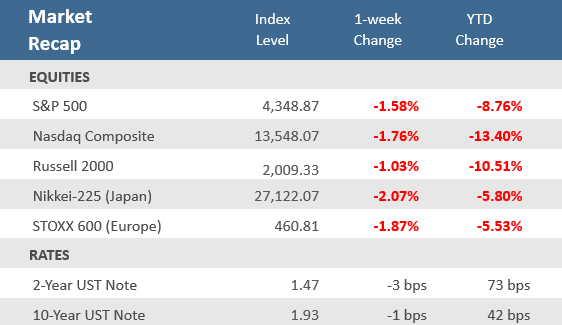
- Equities continued to struggle amid elevated geopolitical risks and expectations for tighter monetary policies as inflation pressures persist ahead of next month’s Fed meeting. Virtually all major global equity indices were down -1% or more, deepening the losses for 2022.
- Despite hotter-than-expected wholesale inflation and import prices, bond yields slipped a bit for the week as investors sought the safety of U.S. Treasurys with the uncertainty of Russia-Ukraine situation. The 10-Year U.S. Treasury yield slid -1 basis point to 1.93% and the 2-Year yield fell -3 basis points to 1.47.
- On the bright side, corporate earnings are holding up nicely. With 84% of S&P 500 companies having reported earnings for Q4-2021, 77% have beaten analysts’ estimates putting the index’s earnings on pace to grow +27%.
Russia-Ukraine Tensions Continue to Disrupt Markets
Stocks started the week right where they ended the prior week, falling on concerns about a possible invasion of Ukraine by Russia and more hawkish comments by St. Louis Fed President James Bullard. On Tuesday stocks roared back as the geopolitical situation seemed to cool on news that the Russian Defense Minister said they began pulling back troops from the Ukraine border. The S&P 500 was up +1.6%, the Dow rose 420 points and the Nasdaq gained +2.5%, its first positive day after four straight down sessions. But that was about the extent of the upside for the week. Renewed concerns about Russia-Ukraine tensions sent stocks sharply lower for much of Wednesday. Markets managed to rally a bit after the minutes from the Federal Reserve January policy meeting were released in the afternoon. The minutes indicated the Fed is set to begin raising rates at its next meeting in March but did not show any evidence that they would begin with a half-point raise like many economists, market strategist, and even Mr. Bullard had been suggesting was a possibility. With the Fed minutes showing that a 50 basis point initial rate hike was not a widely held view among committee members, the S&P 500 was able to trim losses and eke out a small gain for the day. However, that improved sentiment was short lived, and stocks suffered a broad-based sell-off on Thursday amid reports that Russia was positioning for “an imminent invasion” of Ukraine, according to the U.S. Ambassador to the U.N. as well as President Biden in comments to the press. Stocks fell again on Friday as traders seemed weary to hold positions over a long holiday weekend amid growing uncertainty about the escalating conflict in Ukraine. Equities posted a second-straight week of declines with the S&P 500 down -1.6% and the Nasdaq off -1.8%. The small cap Russell 2000 Index fell -1%. Safe-haven securities, like U.S. Treasuries, were positive on the flight-to-safety. The Bloomberg U.S. Treasury Index was up for the first time in four weeks, albeit with a slim +0.05% gain. As Q4 earnings season heads down the home stretch, of the 419 companies that have reported results in the S&P 500, 69.62% have topped revenue forecasts, while 76.79% have bested earnings expectations, per data compiled by Bloomberg. Compared to last year, revenue growth is on pace to be up 15.79% and earnings expansion is on track for 27.41%. Currently, the earnings story seems to be the most positive aspect of markets. With 419 of the S&P 500 companies reported earnings for Q4-2021 (about 84% of the index), 76.8% have beaten analysts’ estimates and growth is on pace for 27.4%.
Chart of the Week
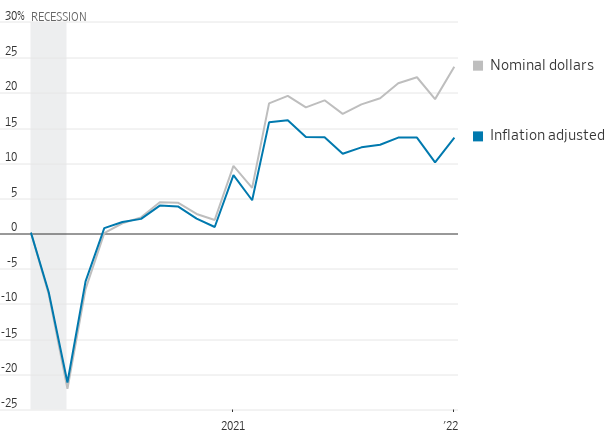
Consumers spent broadly at the start of the year, with the advanced estimate for January Retail Sales surging +3.8% – well ahead of expectations for +2.0% and December’s downwardly revised -2.5% decline. That marked the strongest monthly gain in retail spending since last March when pandemic-related stimulus was being sent to households. Last month’s sales excluding autos and gas were up +3.8%, again much better than the expectations for a +1.0% rise, while December’s reading was negatively revised to a -3.2% drop. Note that retail sales aren’t adjusted for inflation like other government economic data. As a result, higher retail-sales figures can reflect higher prices rather than more purchases. The government doesn’t calculate the role of inflation in this advance report on retail spending, but economists estimate higher prices are a significant part of spending in recent months and that inflation is eroding consumers’ spending power. In the Chart of Week, the Wall Street Journal shows an estimate of inflation-adjusted retail sales by adjusting the retail sales data by the Consumer Price Index (CPI).
Consumers spent broadly at the start of the year
Retail sales, change from February 2020
Note: Seasonally adjusted values deflated using the consumer-price index
Source: WSJ analysis of Labor Department (CPI) and Commerce Department (sales) data via St Louis Fed.
Economic Review
- Wholesale prices rise further, with January Producer Price Index (PPI) up +1.0% from December, double the consensus estimate for a +0.5% gain, and above December’s unrevised +0.2% rise. Core PPI, which excludes the more volatile food and energy components, was up +0.8%, better than expectations of +0.5% and the prior month’s unadjusted +0.5% increase. Year-over-year, the headline PPI was +9.7% higher, matching the prior month and above expectations for a +9.1% rise. The Core PPI increased +8.3% annually, which was above estimates for +7.9% and matching December’s increase.
- The Empire Manufacturing Index, a measure of economic activity in the New York region, moved back to expansion levels (a reading above zero) after surprisingly falling below into contraction last month. The index increased to +3.1 in February from -0.7 in January, which was above expectations of +12.0. New Orders and Employment both increased, with the former moving back above zero into expansion territory.
- The February Philly Fed Manufacturing Business Outlook Index slowed more than expected but remains in expansion territory (a reading above zero), coming in at 16.0 versus estimates of a decrease to 20.0 from January’s 23.2 level. New orders and shipments continued to grow but at slower rates, while employment growth accelerated.
- The Conference Board’s Leading Economic Index (LEI) for January slid -0.3%, well below to the Bloomberg consensus estimate for a +0.2% gain, and following December’s downwardly revised +0.7% increase. The LEI was negative month-over-month for the first time since February 2021, due largely to the negative net contributions from jobless claims, consumer expectations, stock prices, and average workweek, which more than offset positive reads for the interest rate spread and ISM new orders.
- Homebuilder sentiment slide in February as the National Association of Home Builders (NAHB) Housing Market Index fell to 82 from 83 in January, but in-line with expectations. The NAHB said, “Residential construction costs are up 21% on a year over year basis, and these higher development costs have hit first-time buyers particularly hard.”
- January Housing Starts fell -4.1% to an annual rate of 1,638,000 units, below forecasts of 1,695,000 units, and to December’s upwardly revised pace of 1,708,000 units. However, Building Permits, one of the leading indicators tracked by the Conference Board, surprisingly rose by +0.7% to an annual rate of 1,899,000, above expectations for 1,750,000 units, and the upwardly revised 1,885,000 pace in December.
- Existing Home Sales rose +6.7% in January to an annual rate of 6.5 million units, beating expectations for 6.1 million units, which would have matched December’s downwardly revised rate. Existing home sales were higher in each of the major U.S. regions in January. The median existing home price was up +15.4% from a year ago to $350,300, marking the 119th straight month of annual gains as prices rose in each region. Unsold inventory was at 1.6-months, down from the from the 1.9-months pace a year earlier.
- January Import Prices were up +2.0%, beating expectations of +1.2% and December’s downwardly revised -0.4% decrease. Versus last year, prices were up by +10.8%, above estimates for a +10.0% increase and December’s downwardly revised -10.2% rise.
- January Industrial Production rose +1.4%, above estimates of +0.5%, and December’s unrevised -0.1% slid. The Fed said manufacturing output and mining production rose. Capacity Utilization edged up to 77.6%, above estimates and the prior month’s upwardly adjusted 76.6% rate.
- Weekly unemployment claims unexpectedly rose 23,000 to 248,000 from the prior week’s upwardly revised level of 225,000, higher than expectations for 218,000. Continuing claims declined by 26,000 to 1,621,000, below estimates of 1,593,000.
The Week Ahead
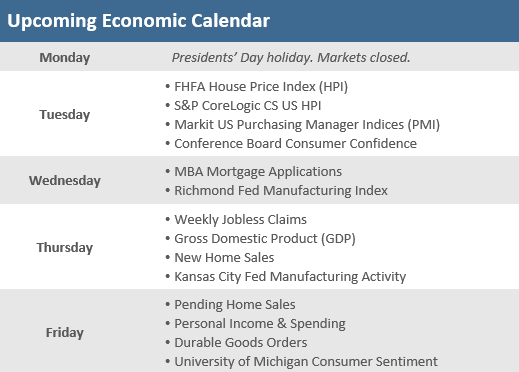
It is a short week with Presidents’ Day holiday on Monday, but at the risk of sounding like a broken record, the potential for another turbulent week exists. The Russia-Ukraine situation is certain to keep investors on edge but there is also a bevy of public appearances by Federal Reserve representatives including the heads of the Richmond, San Francisco, Atlanta, and Cleveland Fed presidents as well as Federal Reserve governors Michelle Bowman and Christopher Waller. The Q4-2021 earnings season is winding down but a number of prominent firms will be reporting results including Home Depot, Medtronic, eBay, Hertz Global, Anheuser-Busch, Moderna, and Liberty Media.
Did You Know?
ANTICIPATION – Between 12/14/2016 and 12/19/2018 (a 2-year period), the Federal Reserve raised short-term interest rates 8 times, with each hike increasing rates 0.25 percentage points (an overall increase of 2 percentage points, or 200 basis points). Over the same 2-year period, the yield on the 2-year U.S. Treasury note rose from 1.27% to 2.65%, an increase of 138 basis points. The Fed has signaled that it will be raising rates again in the U.S., likely starting at the upcoming March meeting. The market is clearly anticipating Fed action, with the yield on the 2-year Treasury note spiking from 0.63% on 12/20/2021 to 1.47% on 02/18/2022, an increase of 83 basis points (0.83 percentage points) in just two months. That included an increase of 45 basis points in January alone, the largest monthly increase since December 2009 (source: Treasury Department, BTN Research, Bloomberg).
STREAK ENDS – Speaking of yields, the yield on the U.S. 10-year Treasury note closed at 2.03% last Thursday 2/10/2022, ending a streak of 633 trading days of closing yields for the 10-year note below 2%, i.e., 8/01/2019 through 2/09/2022. From 1946 to 9/06/2011, the yield on the 10-year Treasury note did not close below 2%. 10-year Treasury notes have been traded in the United States since 1790, i.e., 232 years of trading (source: Treasury Department, BTN Research).
STATE-BY-STATE – The unemployment rate in 12 of the 50 US states dropped to their lowest levels ever in December 2021 based on statewide data tracked since January 1976. The 2 states with the lowest jobless rate were Nebraska (1.7%) and Utah (1.9%). California’s 6.5% jobless rate is the highest in the nation as of December 2021 (source: Bureau of Labor Statistics, BTN Research).
This Week in History
AI COMPUTER DEFEATED – On February 17, in 1996, in a highly publicized event demonstrating the cutting-edge in artificial intelligence at the time, world chess champion Garry Kasparov defeated the IBM supercomputer “Deep Blue”. Deep Blue won just two out of a series of six chess games against Kasparov (source: Benzinga).
Asset Class Performance
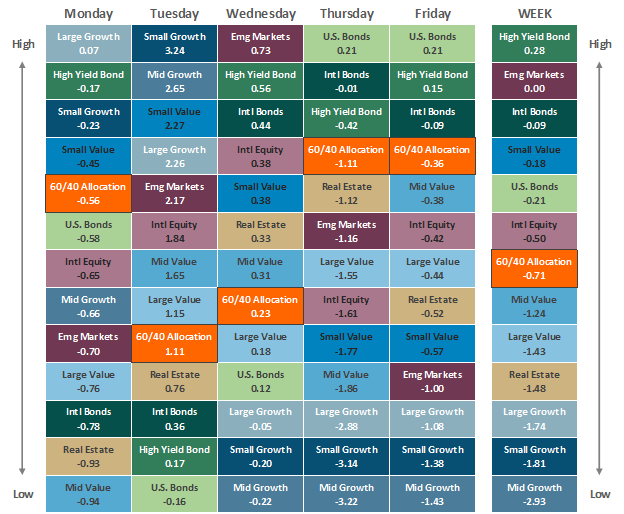
The Importance of Diversification. Diversification mitigates the risk of relying on any single investment and offers a host of long-term benefits, such as lowering portfolio volatility, improving risk-adjusted returns, and helping investments to compound more effectively.
Source: Bloomberg. Asset‐class performance is presented by using market returns from an exchange‐traded fund (ETF) proxy that best represents its respective broad asset class. Returns shown are net of fund fees for and do not necessarily represent the performance of specific mutual funds and/or exchange-traded funds recommended by The Retirement Planning Group. The performance of those funds may be substantially different than the performance of the broad asset classes and to proxy ETFs represented here. U.S. Bonds (iShares Core U.S. Aggregate Bond ETF); High‐Yield Bond (iShares iBoxx $ High Yield Corporate Bond ETF); Intl Bonds (SPDR® Bloomberg Barclays International Corporate Bond ETF); Large Growth (iShares Russell 1000 Growth ETF); Large Value (iShares Russell 1000 Value ETF); Mid Growth (iShares Russell Mid-Cap Growth ETF); Mid Value (iShares Russell Mid-Cap Value ETF); Small Growth (iShares Russell 2000 Growth ETF); Small Value (iShares Russell 2000 Value ETF); Intl Equity (iShares MSCI EAFE ETF); Emg Markets (iShares MSCI Emerging Markets ETF); and Real Estate (iShares U.S. Real Estate ETF). The return displayed as “Allocation” is a weighted average of the ETF proxies shown as represented by: 30% U.S. Bonds, 5% International Bonds, 5% High Yield Bonds, 10% Large Growth, 10% Large Value, 4% Mid Growth, 4% Mid Value, 2% Small Growth, 2% Small Value, 18% International Stock, 7% Emerging Markets, 3% Real Estate.
Chris Bouffard is CIO of The Retirement Planning Group (TRPG), a Registered Investment Adviser. He has oversight of investments for the advisory services offered through TRPG.
Disclaimer: Information provided is for educational purposes only and does not constitute investment, legal or tax advice. All examples are hypothetical and for illustrative purposes only. Past performance of any market results is no assurance of future performance. The information contained herein has been obtained from sources deemed reliable but is not guaranteed. Please contact TRPG for more complete information based on your personal circumstances and to obtain personal individual investment advice.


