Quick Takes
- It was a troubling week as Russia began a full-scale invasion of Ukraine triggering one of the worst military crises in Europe in decades. Given the complexity of the situation with waves of sanctions being issued by Western allies and various reports of both military intensification as well as possible talks between Russian and Ukrainian leaders, there is a great deal of uncertainty over the political and macro landscape and the ultimate impact from the conflict.
- Despite a highly uncertain impact, U.S. stocks were able to mount a tremendous rebound after a swift and sharp drop on the opening of Thursday’s session following the early morning initial incursion into Ukraine. The rally persisted throughout Friday’s session and most major U.S. indices were positive on the week.
- The U.S. economy is on solid footing, with a robust labor market, healthy consumer expenditures, and strong manufacturing and services PMIs. Furthermore, corporate earnings are on pace for another quarter of +30% annual growth and 2022 earnings projections have already been raised about +2.5% since the start of the year.
Russia invades Ukraine; Ukrainians, and markets, show resolve
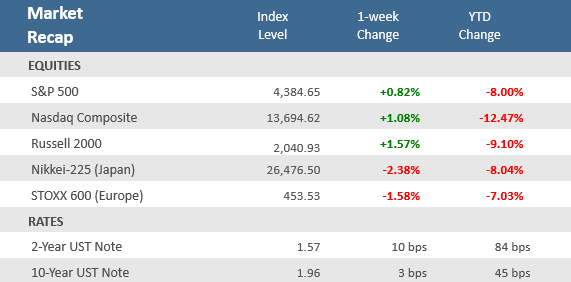
Not many strategists had a war in Europe as part of their 2022 outlooks at the start of the year, but after weeks of military positioning, Russia launched an invasion into Ukraine early Thursday morning. The assault took place throughout Thursday and Friday, both on the ground and through the air, with explosions and missile strikes across several key Ukrainian cities, including its capital, Kyiv. In response, President Biden vowed to impose a wave of sanctions on Russia in an effort to cut Moscow off from the global economy, which would target trillions in assets and include measures against top Russian oligarchs and some Russian state-owned enterprises. The U.K. and the European Union also agreed to sanctions that will target the financial, energy, and transportation sectors. Not surprisingly, financial markets reacted swiftly and sharply to the invasion, with stock markets falling hard and commodity prices soaring along with safe-havens, like Treasurys and gold. However, U.S. equities were able to stage a stunning reversal higher from sizable losses early in Thursday’s session. The S&P 500 and Dow Jones Industrial Average actually opened in correction territory (-10% from their all-time highs earlier this year), while the Nasdaq Composite opened at bear market levels (-20% for all-time highs in November 2021). The Cboe VIX Volatility Index spiked above 37 on Thursday, near hits highest levels of the year. However, in the afternoon, stocks staged a massive comeback, and the S&P erased a -2.6% decline to finish up +1.5%. The Dow erased an 859-point decline and finished up 92 points. The Nasdaq had the most stunning reversal, from an early -3.5% drop to a +3.3% gain at the close.
The rally continued Friday as some reports indicated that President Putin might be willing to hold high-level talks with Ukraine. The S&P added +2.2% on Friday to close the tumultuous week a gain of +0.8%, while the Nasdaq added +1.6% for a +1.1% weekly gain. The small-cap Russell 2000 Index added +1.6% for the week. The market rebound notwithstanding, Russia’s invasion of Ukraine adds new risks to a global economy already challenged with mounting inflation and supply-chain disruptions. It’s too soon to really know the economic impact of the Russian-Ukraine conflict; much will depend on the scale of the fighting and the new sanctions that the U.S. and its allies have promised. On one hand, Russia and Ukraine are major global providers of commodities, and the war there could further exacerbate inflation pressures which the Fed is already pressured to reign in. On the other hand, a material economic slowdown in Europe could prompt the Fed to dial back plans to tighten monetary policy aggressively.
Purely from an economic context, U.S. consumption is still healthy and economic growth is still solid. The Q4-2022 earnings season is poised to post the fourth-straight quarter of 30.0% or better annual growth. And, as detailed below, the economic data is on balance still coming in better than expected. Clearly, the situation in Ukraine is fluid and uncertain, but the current evidence suggests the U.S. economy is still in mid-cycle expansion with solid fundamentals.
Chart of the Week
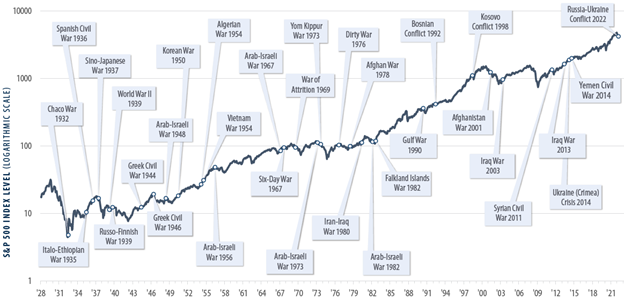
On Thursday, while the financial markets were still reeling from Russia’s invasion of Ukraine, we published a client message titled “Russia Invades (Again),” which included a table and statistics regarding the market reaction to past geopolitical events and the subsequent post-event performance outcome over different periods. As we noted, history has consistently shown that investors benefit from staying invested, even during uncertain and frightening crisis events. To illustrate this in a more visual context, here is a chart from First Trust of the S&P 500 Index since 1928 with several of the major wars and geopolitical conflicts over the years since.
War Times & The Stock Market
How the stock market has performed during war times since 1928
Source: S&P CapIQ, Bloomberg, First Trust Portfolios. Monthly index levels from 12/31/1927 – 2/23/2022.
Economic Review
- The second estimate (of three) for Q4-2021 Gross Domestic Product (GDP), the broadest measure of economic output, showed a quarter-over-quarter annualized rate of expansion of +7.0%, revised up from the +6.9% first release and in line with estimates. Personal Consumption was revised to a +3.1% increase, versus expectations of an upward revision to a 3.4% rise from the initially reported +3.3% pace of growth. Inflation came in higher than expected, with the GDP Price Index revised up to +7.1%, versus estimates of an unadjusted +6.9% increase. The Core PCE Index, Fed’s primary inflation gauge, was up +5.2%, which is the biggest annual gain since April 1983. Orders for Durable Goods reflected the buoyant spending, rising +1.6%, double the forecast.
- The preliminary February IHS Markit U.S. Manufacturing PMI Index rose further into economic expansion territory (above levels of 50), hitting 57.5 from 55.5 in January, well above expectations of 56.0. Likewise, the preliminary IHS Markit U.S. Services PMI Index showed higher-than-expected growth for the key U.S. services sector, jumping to 56.7 from January’s 51.2, well above forecasts for an increase to 53.0.
- The February Conference Board Consumer Confidence Index fell to 110.5, below January’s downwardly revised 111.1, but above the estimate for 110.0. The overall index was dragged by the Expectations Index of business conditions for the next six months component of the index, which fell to 87.5 from January’s downwardly revised 88.8. The Present Situation Index component increased to 145.1 from the previous month’s downwardly revised 144.5.
- The February final University of Michigan Consumer Sentiment Index was unexpectedly revised higher to 62.8, from the preliminary 61.7, where it was expected to remain. The upward revision came as the Expectations component of the survey was adjusted higher to more than offset a downward revision to the Current Conditions component. The overall index was well below January’s 67.2 level as both Expectations and Current Conditions fell over the month.
- U.S. home-price growth surged to a record in 2021. The S&P CoreLogic Case-Shiller National Home Price Index, which measures average home prices in major metropolitan areas across the U.S., jumped +18.8% in the 12 months that ended in December, matching the prior month. That was the highest calendar-year increase since the index began in 1987.
- The December Federal Housing Finance Agency (FHFA) House Price Index increased +1.2% for the month, compared to an upwardly revised +1.2% in November. During calendar year 2021, house prices rose a record +16.8%, following a +7.9% increase in 2020. The home price series dates to January 1991.
- New Home Sales declined -4.5% for the month of January to an annual rate of 801,000 units, just shy of forecasts of 802,000 units, and below December’s upwardly revised 839,000-unit. The median home price rose +13.4% year-over-year to $423,300. New home inventory rose to 6.1 months from December’s 5.6-months supply. Annual sales were lower in all regions except for the West. Pending Home Sales unexpectedly fell by -5.7% in January, versus estimates for a +0.2% rise, and below December’s upwardly revised -2.3% drop. Sales tumbled -9.1% for the year, far more than forecasts for a -1.8% drop, and follow December’s upwardly revised -5.8% decline.
- The February Richmond Fed Manufacturing Activity Index remained in expansion territory (above zero) but unexpectedly fell to 1 from 8 in January, far below estimates of 10. New order volume fell into negative territory for the first time in 5 months. The February Kansas City Fed Manufacturing Activity Index moved further into expansion (above zero) than expected with a 29-point rise from January’s unrevised 24 and above expectations for an increase to 25.0.
- Weekly unemployment claims fell more than the expected 235,000 to 232,000, which was well below the prior week’s upwardly revised 249,000. Continuing claims, a proxy for the total number of people on unemployment rolls through regular state programs, declined by 112,000 to 1,476,000 million for the week ended Feb. 12—the lowest level since 1970—and well below estimates of 1,580,000.
The Week Ahead
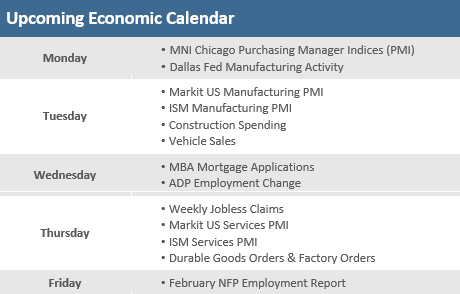
Market attention will obviously continue to focus on the Russian invasion of Ukraine and the geopolitical fallout. Outside the geopolitical realm, a big focus will be the views of Federal Reserve Chair Jerome Powell when he appears before both the House and Senate banking panels on Wednesday and whether the Russia-Ukraine conflict softens his hawkish commentary following the January Federal Open Market Committee (FOMC) meeting. It’s a relatively light week for economic data. Competitors Markit and ISM will release their respective Purchasing Manager Indices (PMI) on Tuesday and Thursday. The big event will be the February employment report on Friday which is likely to show further increases in employment and a drop of the unemployment rate back to 3.9%.
Did You Know?
NEW WHEELS – The average price of a new vehicle purchased in the United States in December 2021 was $45,743, an all-time high (source: J.D. Power, BTN Research).
THE PRICE OF ELITE – The average 1-year cost of tuition, fees, room and board at a private 4-year American college for the 2021-2022 school year was $50,580 (source: College Board, BTN Research).
BAD GUESS – As part of a 10-year budget projection made by the Congressional Budget Office in January 2012 (i.e., 10 years ago), the U.S. national debt, which was $15.223 trillion as of 12/31/2011, was forecasted to reach $21.665 trillion as of 9/30/2022. Our actual national debt is $30.036 trillion as of 2/10/2022 (source: CBO, BTN Research).
This Week in History
DOW MILESTONE – On February 23, 1995, the Dow Jones Industrial Average (the Dow) crossed 4,000 for the first time. The Wall Street Journal printed the headline “Stocks Cross 4000 for the First Time, But the Visit There May Be Brief.” However, the Dow only briefly dipped back below 4,000 for two days before surging higher and never looking back. The down crossed above 5,000 by the end of 1995 and was above 6,000 by late 1996. The Dow ultimately peaked at 11,750 during the height of the dot-com bubble in early 2000. Since that time, the lowest it has traded was 6,469 during the bottom of the 2008 financial crisis. At Friday’s (February 25, 2022) close the Dow was at 34,059, representing a 1,478% total return (i.e. with dividends reinvested), or 10.7% annualized, since crossing that 4,000 level (source: Benzinga, Bloomberg).
Asset Class Performance
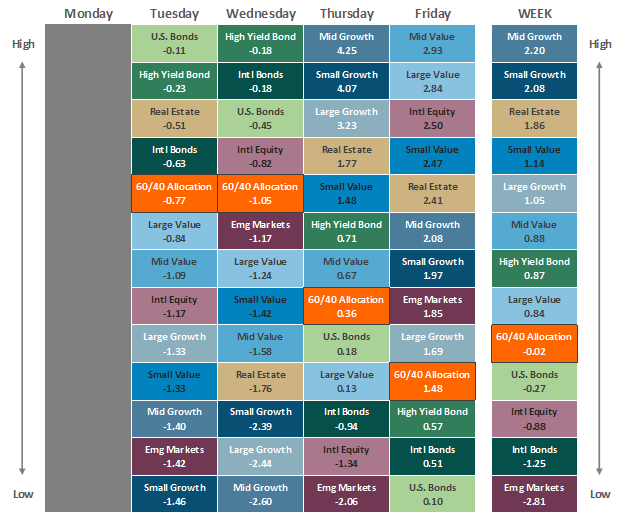
The Importance of Diversification. Diversification mitigates the risk of relying on any single investment and offers a host of long-term benefits, such as lowering portfolio volatility, improving risk-adjusted returns, and helping investments to compound more effectively.
Source: Bloomberg. Asset‐class performance is presented by using market returns from an exchange‐traded fund (ETF) proxy that best represents its respective broad asset class. Returns shown are net of fund fees for and do not necessarily represent the performance of specific mutual funds and/or exchange-traded funds recommended by The Retirement Planning Group. The performance of those funds may be substantially different than the performance of the broad asset classes and to proxy ETFs represented here. U.S. Bonds (iShares Core U.S. Aggregate Bond ETF); High‐Yield Bond (iShares iBoxx $ High Yield Corporate Bond ETF); Intl Bonds (SPDR® Bloomberg Barclays International Corporate Bond ETF); Large Growth (iShares Russell 1000 Growth ETF); Large Value (iShares Russell 1000 Value ETF); Mid Growth (iShares Russell Mid-Cap Growth ETF); Mid Value (iShares Russell Mid-Cap Value ETF); Small Growth (iShares Russell 2000 Growth ETF); Small Value (iShares Russell 2000 Value ETF); Intl Equity (iShares MSCI EAFE ETF); Emg Markets (iShares MSCI Emerging Markets ETF); and Real Estate (iShares U.S. Real Estate ETF). The return displayed as “Allocation” is a weighted average of the ETF proxies shown as represented by: 30% U.S. Bonds, 5% International Bonds, 5% High Yield Bonds, 10% Large Growth, 10% Large Value, 4% Mid Growth, 4% Mid Value, 2% Small Growth, 2% Small Value, 18% International Stock, 7% Emerging Markets, 3% Real Estate.
Chris Bouffard is CIO of The Retirement Planning Group (TRPG), a Registered Investment Adviser. He has oversight of investments for the advisory services offered through TRPG.
Disclaimer: Information provided is for educational purposes only and does not constitute investment, legal or tax advice. All examples are hypothetical and for illustrative purposes only. Past performance of any market results is no assurance of future performance. The information contained herein has been obtained from sources deemed reliable but is not guaranteed. Please contact TRPG for more complete information based on your personal circumstances and to obtain personal individual investment advice.


