Quick Takes
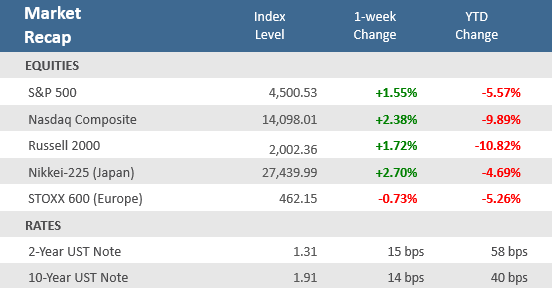
- Major U.S. stock market indices had their best week of the year despite sharp losses on Thursday. For the week, the S&P 500 was +1.6% higher, the Nasdaq rose +2.4%, the Dow gained +1.1%, and the small cap Russell 2000 advanced +1.7%. Stocks had been under pressure last month as worries of higher interest rates weighed on investor sentiment.
- Rising Treasury yields and strong jobs data took a toll on bonds. The Bloomberg U.S. Aggregate Bond Index declined for four of the five days last week, finishing the week with a -1.0% loss, its fourth weekly decline in 2022.
- The employment picture was mixed for the week after a much weaker-than-expected ADP Employment Change report on Wednesday had markets concerned about Friday’s BLS Nonfarm Payrolls employment report. However, that came in much better-than-expected with 467,000 new jobs versus expectations for just 125,000.
Stocks end best week of the year so far, buoyed by jobs report
After falling into correction territory (-10%) in late January, the S&P 500 stabilized last week, rising in four of the five days to end the week with a +1.6% gain – its best week of 2022. The win streak from 1/28/22 – 2/2/22 was the first four-day win streak since late December. In fact, January’s sole winning streak for the index was back-to-back gains on Jan 11th and 12th. Even with the rally early this week, the markets continue to cope with the economic and earnings implications of a more aggressive Fed. On Thursday, the S&P 500 sank -2.4%, its worst single-day drop since February 25 of 2021, highlighting the skittishness of investors in the new regime of heightened volatility. Thursday’s selloff was courtesy of very disappointing earnings and guidance by Meta Platforms (Facebook’s parent company). However, after the close Thursday, Amazon reported much stronger-than-expected earnings and guidance, that helped turn investor sentiment more positive for Friday’s session. In addition to cheering Amazon’s earnings, Friday brought a much stronger-than-expected January jobs report, which showed 467,000 new jobs added to the economy in January when only 125,000 were expected (and some economists were forecasting job losses in January). The technology-heavy Nasdaq Composite Index was down nearly twice as much as the S&P 500 in 2022, but bounced back more strongly during the week, advancing +2.4% despite plunging -3.7% on Thursday (its worst day since Sept 8, 2020).
The strong jobs data sent Treasuries yields sharply higher, as the rate on the 2-year Treasury note hit the highest since March 2020 and the yield on the 10-year note touched a level not seen since the end of 2019. Of course, bond prices decline as yields go up and the Bloomberg U.S. Aggregate Bond Index declined in four of the five days last week, closing the week down -1.0%, its fourth weekly decline in 2022. The headline bond index is down -3.0% in 2022 after falling -1.5% in 2021, which was its first negative year since 2013. And it’s not just the U.S. Federal Reserve that is taking a more aggressive stance against rising inflation. On Thursday the Bank of England raised interest rates for the second consecutive meeting for the first time since 2004, and inflation in the eurozone surprised markets with a stronger than expected reading that may further pressure European Central Bank to take action soon.
Chart of the Week
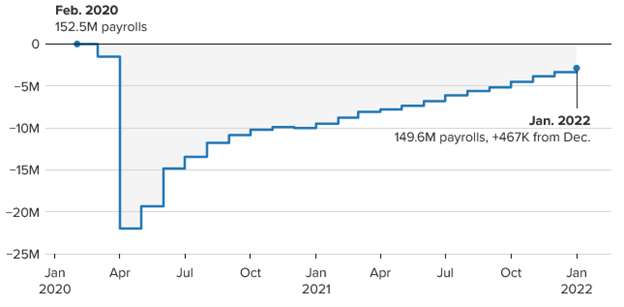
There was a lot to digest for labor market data during the week. Wednesday’s ADP Employment Change Report showed private sector companies cut -301,000 jobs in January, far below the Bloomberg consensus estimates for a +180,000 gain. It was the first time ADP reported negative job growth since December 2020. Moreover, December’s gain of +807,000 jobs was revised lower to +776,000. ADP said, “The labor market recovery took a step back at the start of 2022 due to the effect of the Omicron variant and its significant, though likely temporary, impact to job growth.” The surprisingly poor ADP results had markets preparing for a negative surprise with Friday’s key Nonfarm Payrolls employment report. However, the Bureau of Labor Statistics (BLS) reported a surprisingly robust gain of +467,000 jobs in January, well above the expectations for a +125,000 gain, and December was adjusted decisively higher to an increase of +510,000 from the initial reading of a +199,000 gain. Meanwhile, the Labor Force Participation Rate also rose solidly to 62.2% from December’s unrevised 61.9%, in line with expectations. Leisure and hospitality led the gains, while professional and business services and retail also posted big numbers. The unemployment rate did rise slightly to 4%, up from December’s 3.9% where forecasts expected it to remain. Wage pressures persist with Average Hourly Earnings increased +0.7%, above expectations for a rise of +0.5%, which is also where December’s downwardly revised level was. The conflicting ADP and BLS jobs data will keep the market and Fed focused on future reports for clarity on the health of the labor market and impact of wages on inflation as payrolls get close to reaching their pre-pandemic highs.
Payrolls jump a surprising +467,000 in January despite omicron surge
Difference in total U.S. employment from pre-pandemic levels in Feb. 2020
Source: Bureau of Labor Statistics. Data is seasonally adjusted.
Economic Review
- The January Dallas Fed Manufacturing Index unexpectedly fell to 2.0 from 7.8 in December, far below estimates for 8.0 (but still in economic expansion territory, which are readings above 0). Production and shipments fell, while shipments dropped solidly but remained above zero. Growth in new orders accelerated slightly and employment growth slipped.
- The January Chicago Purchasing Managers Index (PMI) unexpectedly expanded further (a reading above 50), rising to 65.2 from 64.3 in December, well ahead of Bloomberg estimates for a decline to 61.5. Growth in new orders and production continued, but prices paid did decelerate (yet remain in expansion territory).
- The final January Markit U.S. Manufacturing PMI Index was unrevised at 55.5, matching forecasts, but below December’s reading of 57.7 (readings above 50 denote economic expansion). Markit said new orders rose at the slowest pace since September 2020, which allowed firms to work through backlogs, which expanded at the slowest pace in 11 months. However, Markit added that firms were their most upbeat since November 2020 regarding the outlook for output. The Markit U.S. Services PMI Index was unexpectedly revised higher to 51.2 from the preliminary 50.9 level, where it was forecasted to remain, but below December’s reading of 57.6. Markit noted that growth momentum waned notably, the omicron variant hampered the upturn in new business as domestic and foreign demand conditions weakened.
- The January Institute for Supply Management (ISM) Manufacturing PMI showed manufacturing growth continued to expand, but at a declining rate, falling to 57.6 from 58.7 in December, but roughly in line with the Bloomberg consensus estimate of a drop to 57.5. Growth in new orders, production, inventories, and supplier deliveries all decelerated, while employment rose. Prices paid increased noticeably, from 7.9 points to 76.1. The ISM Services PMI also remained at expansion levels but decelerated to 59.9 from the upwardly revised 62.3 level in December yet was above expectations for 59.5. Growth in new orders, business activity, and employment growth all slipped month-over-month.
- December Factory Orders slipped -0.4% from November, in line with expectations. Durable Goods Orders were revised up to a -0.7% decrease for December from the preliminary report last week, and excluding transportation, orders were adjusted upward to a +0.6% advance. Finally, nondefense Capital Goods Orders excluding aircraft—considered a proxy for capital spending—were positively revised to a +0.3% gain.
- December Construction Spending rose +0.2%, below expectations for +0.6% and down from November’s downwardly revised +0.6%. Residential spending increased +1.1%.
- The December Job Openings and Labor Turnover Survey (JOLTS), a measure of unmet demand for labor, showed job openings rose to 10.9 million jobs available to be filled, up from 10.6 in November and above expectations for 10.3. The report showed the hiring rate decreased slightly to 4.2% from 4.4% in November, and separations slowed to 4.0% from 4.2% the prior month. The quit rate fell to 2.9% from 3.0% in November.
- Weekly unemployment claims fell 23,000 from the prior week’s upwardly revised level of 290,000 to 238,000, below expectations for 245,000. Continuing claims fell 44,000 to 1,628,000, above estimates of 1,620,000.
The Week Ahead
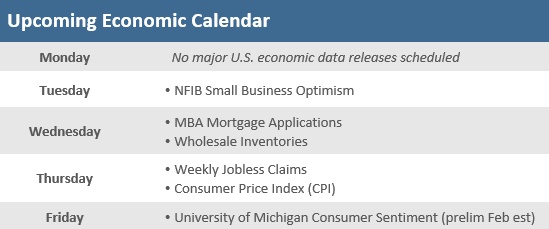
After a few weeks full of economic reports, the upcoming week will be relatively light. After January’s surprisingly strong jobs report, focus swings to consumer inflation with Thursday’s CPI report. Another high CPI print could add further pressure on the Fed to be aggressive with its rate hikes and balance sheet reduction plans. Bloomberg Economics estimates CPI to hit a +7.3% annual rate. Q4-2021 earnings season has passed the halfway point, but the calendar remains full of companies releasing earnings including Coca-Cola, PepsiCo, Kellogg, Walt Disney, and Pfizer.
Did You Know?
UNHAPPY MEAL — Inflation is coming to a longtime refuge of price-conscious consumers: restaurant value menus. Burger King, Denny’s and Domino’s Pizza are among the chains that are reducing their menu of discounted items or shrinking portions to try to improve their profits. Prices for food away from home rose 6% in 2021, the biggest increase in nearly four decades (source: The Wall Street Journal).
ONE IS THE LONELIEST NUMBER — The S&P 500 fell -5.2% in the first month of 2022, which was the worst January performance since the index lost -8.4% (total return) in January 2009. The tumble in 2009 continued through 3/09/2009 when the S&P 500 reached a -24.6% YTD loss. The next day (3/10/2009) began an 11-year bull market that ran until 2/19/2020 when the global pandemic struck. The S&P 500 total return during that 11-year bull market was 490.6%, or 17.6% annualized (source: BTN Research, Bloomberg).
CORRECTIONS HAPPEN — When the S&P 500 closed at 4,327 on Thursday 1/27/2022, the index was down -9.8% from an all-time closing high of 4,797 set just weeks before on 1/3/2022. A decline of -10% would be the S&P’s 21st pullback of at least -10% (but less than -20%) in the last 50 years but would be its 6th since 2015. Declines of at least -10% but less than -20% from a previous closing high are considered “corrections” (source: BTN Research).
This Week in History
On January 31 in 1940, the first monthly Social Security check was issued to Ida May Fuller, a 65-year-old retired legal secretary in Ludlow, Vt. Because Social Security launched only three years before she retired, Ms. Fuller had paid a cumulative total of only $24.75 in Social Security taxes. But her initial monthly check was $22.54—and, by the time she died in 1975 at the age of 100, she had collected a total of $22,888.92 in benefits, nearly 1,000 times what she paid in (source: The Wall Street Journal).
Asset Class Performance
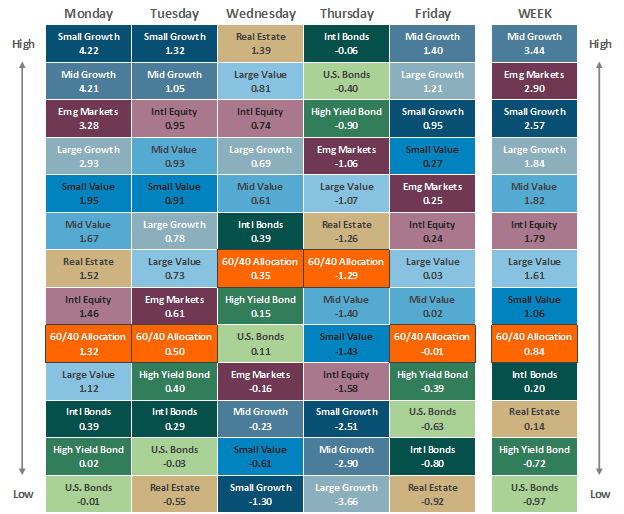
The Importance of Diversification. Diversification mitigates the risk of relying on any single investment and offers a host of long-term benefits, such as lowering portfolio volatility, improving risk-adjusted returns, and helping investments to compound more effectively.
Source: Bloomberg. Asset‐class performance is presented by using market returns from an exchange‐traded fund (ETF) proxy that best represents its respective broad asset class. Returns shown are net of fund fees for and do not necessarily represent the performance of specific mutual funds and/or exchange-traded funds recommended by The Retirement Planning Group. The performance of those funds may be substantially different than the performance of the broad asset classes and to proxy ETFs represented here. U.S. Bonds (iShares Core U.S. Aggregate Bond ETF); High‐Yield Bond (iShares iBoxx $ High Yield Corporate Bond ETF); Intl Bonds (SPDR® Bloomberg Barclays International Corporate Bond ETF); Large Growth (iShares Russell 1000 Growth ETF); Large Value (iShares Russell 1000 Value ETF); Mid Growth (iShares Russell Mid-Cap Growth ETF); Mid Value (iShares Russell Mid-Cap Value ETF); Small Growth (iShares Russell 2000 Growth ETF); Small Value (iShares Russell 2000 Value ETF); Intl Equity (iShares MSCI EAFE ETF); Emg Markets (iShares MSCI Emerging Markets ETF); and Real Estate (iShares U.S. Real Estate ETF). The return displayed as “Allocation” is a weighted average of the ETF proxies shown as represented by: 30% U.S. Bonds, 5% International Bonds, 5% High Yield Bonds, 10% Large Growth, 10% Large Value, 4% Mid Growth, 4% Mid Value, 2% Small Growth, 2% Small Value, 18% International Stock, 7% Emerging Markets, 3% Real Estate.
Chris Bouffard is CIO of The Retirement Planning Group (TRPG), a Registered Investment Adviser. He has oversight of investments for the advisory services offered through TRPG.
Disclaimer: Information provided is for educational purposes only and does not constitute investment, legal or tax advice. All examples are hypothetical and for illustrative purposes only. Past performance of any market results is no assurance of future performance. The information contained herein has been obtained from sources deemed reliable but is not guaranteed. Please contact TRPG for more complete information based on your personal circumstances and to obtain personal individual investment advice.


