Quick Takes
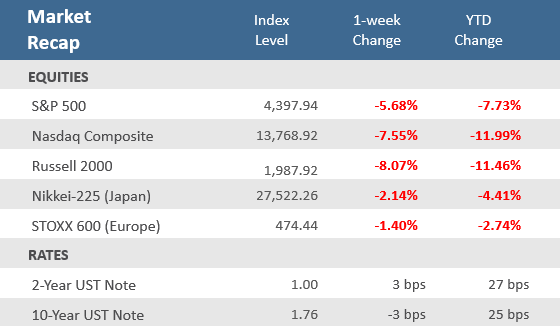
- The only good news for stocks over the past week was that the market was only open for four days. The S&P 500 fell about -1% or more every day of the week on its way to a weekly loss of -5.7%, its worst one-week performance since March 20, 2020. Tech stocks were particularly hard hit, sending the Nasdaq down -7.6% for the week.
- The yield on the U.S. 10-year Treasury note got as high as 1.87% during the week but came back down to close the week at 1.76% which was actually three basis points lower than the prior Friday. The 2-year yield continued its ascent with a gain of three basis points as it crossed the 1% level for the first time since February 2020.
- Most economic data for the week was softer-than-expected, a trend that has persisted since mid-December, and marks a stark contrast to most of last year when data was consistently better-than-expected. That may actually help temper the aggressiveness of the Federal Reserve as it pivots to monetary tightening – something they will discuss on Wednesday.
Tech wreck puts Nasdaq in correction territory
U.S. markets were closed Monday due to the Martin Luther King Jr. holiday, which it turns out was the highlight of the week. Stocks were down every day of the week on their way to their third straight week of losses, and to their worst weekly decline since March 20, 2020, at the depths of the pandemic. The S&P 500 lost -5.7%, but it was the Nasdaq and small-cap stocks that were hit the hardest, sinking -7.6% and -8.1%, respectively. It is the worst start of a year for the Nasdaq since 2008, now down -12% in 2022, which puts the index in correction territory (double-digit drawdowns are generally considered corrections). Rising bond yields are the primary culprit for the sharp downward re-pricing of technology and growth stocks, which get particularly hard hit by higher yields because they rely on low rates to borrow for future investing in innovation and their future earnings look less attractive as rates are spiking. Treasury yields have posted strong gains in 2022 as bond investors anticipate Federal Funds rate hikes, potentially as soon as March. The 2-year U.S. Treasury yield hit 1% during the week for the first time since February 2020. It has risen 0.27% just in 2022 alone. The 2-year Treasury yield is watched as a gauge of where the Fed will set their Federal Funds rate. Yields have risen along the yield curve, with the benchmark 10-year Treasury rising as high as 1.87%, its highest since January 2020, before backing off at the end of the week to finish at 1.76%, putting it up 0.25% in 2022. The 30-year Treasury yield is above 2% again, finishing the week at 2.09%. Investors will be keyed into the Federal Reserve this week as they meet on Tuesday and Wednesday and will release their rate decision and timeline for tightening monetary policy on Wednesday afternoon. The most likely scenario is an announcement confirming that they will end their bond purchasing program by March and signal a 0.25% rate hike for March as well. Some big economic reports could also have the potential to add turbulence with fourth-quarter GDP being reported on Thursday and Personal Consumption Expenditure data on Friday (which includes the Fed’s favorite inflation measure). And if that wasn’t enough noise in the markets, this week will be a very heavy week for corporate earnings reports with prominent tech companies like Microsoft, Tesla, and Apple reporting, as well as numerous blue-chip stocks, such as 3M, IBM, Intel, Caterpillar, and American Express. Buckle up, with all those headline-producing activities, and investors already jittery, the potential for more choppiness is high.
Chart of the Week
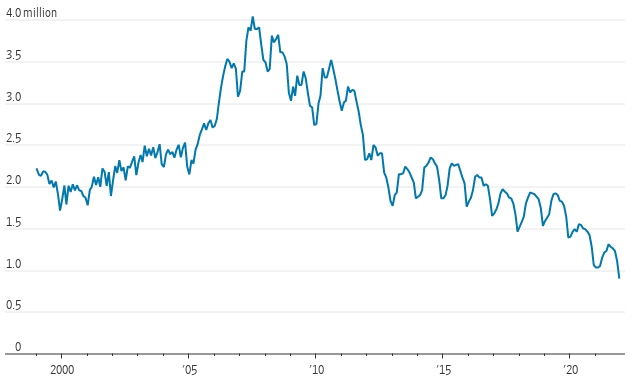
December Existing Home Sales fell, snapping a three-month winning streak, as the U.S. housing supply hit a record low. December’s existing-home sales dropped -4.6% month-over-month to an annual rate of 6.18 million units, below expectations of 6.42 million units, and November’s upwardly revised 6.48 million rates. It was a -7.1% drop from last December. Existing home sales were lower in all four major U.S. regions both on a month-over-month and year-over-year basis. The Median Existing Home Price was up +15.8% from a year ago to $358,000, marking the 118th straight month of annual gains. Unsold inventory was at a 1.8-months pace at the current sales rate, down from the 2.2-months pace a year earlier. National Association of Realtors Chief Economist Lawrence Yun said, “December saw sales retreat, but the pull-back was more a sign of supply constraints than an indication of a weakened demand for housing,” adding that, “Sales for the entire year finished strong, reaching the highest annual level since 2006.”
The supply of homes for sale fell to a record low in December
U.S. existing homes available for sale at end of month
Source: National Association of Realtors, The Wall Street Journal.
Economic Review
- Factory activity in the New York region surprisingly fell into contraction (a reading below zero). The January Empire Manufacturing Index tumbled to -0.7 which was well below Bloomberg estimates of +25.0 and +31.9 in December. The 32.6-point plunge in overall business conditions was the largest since April 2020 in the immediate aftermath of the pandemic. Still, manufacturers in NY remained upbeat about the outlook, with the measure of future business conditions remaining a solid 35.1. Furthermore, the capital expenditures index rose to the highest since 2006 and technology spending improved slightly, indicating firms plan large increases in investment in coming months.
- In contrast to the Empire results, the January Philly Fed Manufacturing Business Outlook Index moved further into expansion territory (above zero) with an increase to 23.2, above estimates of 19.0 and compared to 15.4 in December.
- Homebuilder confidence dropped for the first time in four months, as inflation hit materials. The January National Association of Home Builders (NAHB) Housing Market Index showed homebuilder sentiment fell to 83 from 84 in December, where it was forecasted to remain. Of the index’s three components, current sales conditions was unchanged at 90. Sales expectations in the next six months fell -2 points to 83, and buyer traffic fell -2 points to 69. The average rate on the 30-year fixed is now about 50 basis points higher than it was a month ago and 75 basis points higher than it was one year ago.
- December Housing Starts rose +1.4% to an annual pace of 1,702,000 units, above forecasts of 1,650,000 units, and compared to November’s downwardly revised 1,678,000 units. Building Permits, a leading indicator tracked by the Conference Board, jumped +9.1% to an annual rate of 1,873,000, above expectations of 1,703,000 units and the upwardly revised 1,717,000 units in November.
- Weekly unemployment claims rose 55,000 to 286,000, far above expectations for 225,000, and above the prior week’s upwardly revised level of 231,000. Continuing rose 84,000 to 1,635,000, above estimates of 1,563,000.
The Week Ahead
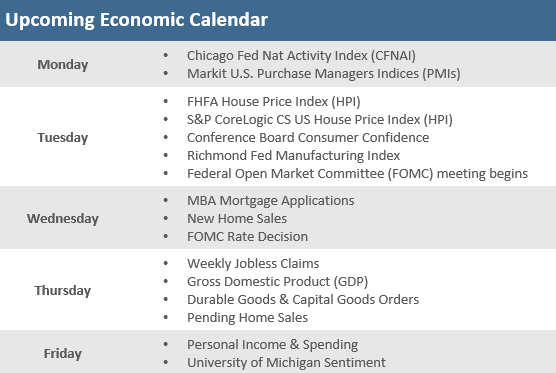
The big event for markets this week is the Federal Reserve’s meeting Tuesday and Wednesday. The Fed is not expected to raise interest rates or change policy at this meeting, but it is expected to remain hawkish and could signal that its first interest rate hike will come in March when it finishes up its bond-buying program. Important economic data in the week ahead include fourth-quarter GDP on Thursday and Friday’s personal consumption expenditures data, which includes the Fed’s preferred inflation measure. Earnings season is also in full swing with Microsoft, Tesla, and Apple reporting Tuesday, Wednesday and Thursday, respectively. There are also a host of blue-chip stocks reporting, such as 3M, IBM, Intel, Caterpillar, and American Express.
Did You Know?
YEAR TWO IN THE WHITE HOUSE — This year (2022) is the 2nd year of Joe Biden’s 1st 4-year presidential term. The S&P 500 index has been positive on a total return basis during 15 of the last 24 “presidential 2nd-years,” i.e., 2nd-years dating back to 1929. The average performance for the S&P 500 index during the last 24 “presidential 2nd-years” has been a total return of +6.7% (source: BTN Research).
RUSH TO BUY — Americans borrowed a record $1.61 trillion from mortgage lenders in 2021 to purchase homes, breaking the previous record high for purchase loans of $1.51 trillion set in 2005. The purchase loan total does not include individuals who refinanced existing mortgages (source: Mortgage Bankers Association, BTN Research).
JUICED — Frozen concentrated orange-juice futures ended Friday at about $1.50 a pound, up roughly +50% since the pandemic began. Government agricultural forecasters said they expect the smallest Florida orange crop since World War II, touching off a rally in juice futures that were already at their highest level in years (source: The Wall Street Journal).
This Week in History
On January 18 in 1956, after more than a half-century as a private company, Ford Motor went public when the Ford Foundation sold 10.2 million shares at $64.50. Ford stock has gained more than +150% in the past 12 months, compared with gains of around +23% for the S&P 500 index, powered in part from an aggressive new electric vehicle strategy (source: The Wall Street Journal).
Asset Class Performance
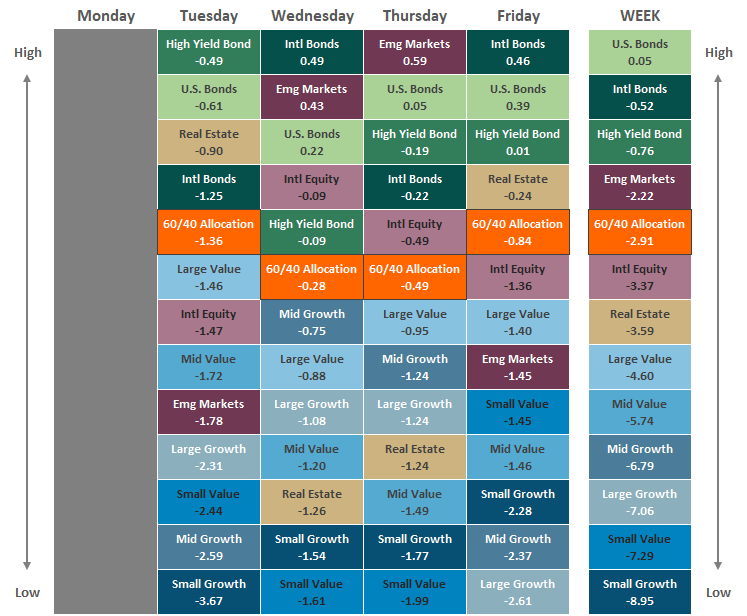
The Importance of Diversification. Diversification mitigates the risk of relying on any single investment and offers a host of long-term benefits, such as lowering portfolio volatility, improving risk-adjusted returns, and helping investments to compound more effectively.
Source: Bloomberg. Asset‐class performance is presented by using market returns from an exchange‐traded fund (ETF) proxy that best represents its respective broad asset class. Returns shown are net of fund fees for and do not necessarily represent the performance of specific mutual funds and/or exchange-traded funds recommended by The Retirement Planning Group. The performance of those funds may be substantially different than the performance of the broad asset classes and to proxy ETFs represented here. U.S. Bonds (iShares Core U.S. Aggregate Bond ETF); High‐Yield Bond (iShares iBoxx $ High Yield Corporate Bond ETF); Intl Bonds (SPDR® Bloomberg Barclays International Corporate Bond ETF); Large Growth (iShares Russell 1000 Growth ETF); Large Value (iShares Russell 1000 Value ETF); Mid Growth (iShares Russell Mid-Cap Growth ETF); Mid Value (iShares Russell Mid-Cap Value ETF); Small Growth (iShares Russell 2000 Growth ETF); Small Value (iShares Russell 2000 Value ETF); Intl Equity (iShares MSCI EAFE ETF); Emg Markets (iShares MSCI Emerging Markets ETF); and Real Estate (iShares U.S. Real Estate ETF). The return displayed as “Allocation” is a weighted average of the ETF proxies shown as represented by: 30% U.S. Bonds, 5% International Bonds, 5% High Yield Bonds, 10% Large Growth, 10% Large Value, 4% Mid Growth, 4% Mid Value, 2% Small Growth, 2% Small Value, 18% International Stock, 7% Emerging Markets, 3% Real Estate.
Chris Bouffard is CIO of The Retirement Planning Group (TRPG), a Registered Investment Adviser. He has oversight of investments for the advisory services offered through TRPG.
Disclaimer: Information provided is for educational purposes only and does not constitute investment, legal or tax advice. All examples are hypothetical and for illustrative purposes only. Past performance of any market results is no assurance of future performance. The information contained herein has been obtained from sources deemed reliable but is not guaranteed. Please contact TRPG for more complete information based on your personal circumstances and to obtain personal individual investment advice.


