Quick Takes
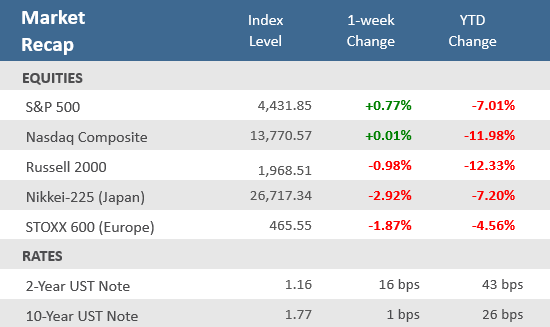
- Major U.S. stock market indices narrowly averted another negative week with a dramatic late afternoon surge on Friday. The S&P 500 gained +2.4% on Friday to end a three-week losing streak with a +0.8% weekly advance.
- It was a wild, roller-coaster ride for stock investors that saw the S&P 500 fluctuate in a range of at least 2.25% every day of the week. For the week the Nasdaq Composite traded in a 7% range but basically closed right where it started on Monday.
- The Federal Reserve ended its two-day meeting and press conference with a hawkish outlook that helped send short-term bond yields up and bond market indices down. The 2-year U.S. Treasury note popped +16 basis points over the week, closing near its post-pandemic highs. The Bloomberg Aggregate Bond Index fell -0.4% for the week.
“Buzzer Beater” finish on Friday breaks weekly losing streak
Barely four weeks ago, the S&P 500 was hitting record highs. At its lows last Monday, it was into correction territory (generally defined as a -10% pullback), down almost -12% from its January 4 all-time high. Stocks were poised for a fourth consecutive week entering Friday afternoon, but a dramatic late-afternoon rally turned the S&P 500 and Dow Jones Industrial Average positive to cap a wild, roller-coaster of a ride week. The S&P 500 jumped +2.4% on Friday, its best day since June 2020, to help it break the three-week losing streak with a +0.8% weekly gain. The Nasdaq rallied +3.1% on Friday, just enough to barely eke out a +0.01% gain for the week. The small-cap Russell 2000 index couldn’t match the larger cap indices as it fell -1.0%. It was a big week for economic news, especially with the Federal Open Market Committee (FOMC) decision on rates and press conference, as well as fourth-quarter gross domestic product (GDP). As expected, the Federal Reserve left rates unchanged, but signaled it will begin raising them in March and pointed out that the Fed’s balance sheet is larger than it needs to be. The first estimate of fourth-quarter GDP came in much higher than economists’ expectations, expanding at an annual rate of +6.9% in the final quarter of 2021. That put the full year 2012 GDP growing at 5.5%, which was the highest calendar year growth since 1984.
Meanwhile, Q4 earnings season continued with mixed results and guidance. With about one-third of the S&P 500 companies having reported for q4-2021, earnings per share indicates that earnings growth is approximately +24% over last year, according to data from FactSet. Refinitiv reports that 70% of those reporting have beaten Wall Street analysts’ estimates. With another busy week of earnings reports, and a full economic calendar, stock markets are likely to remain on their roller coaster ride.
Chart of the Week
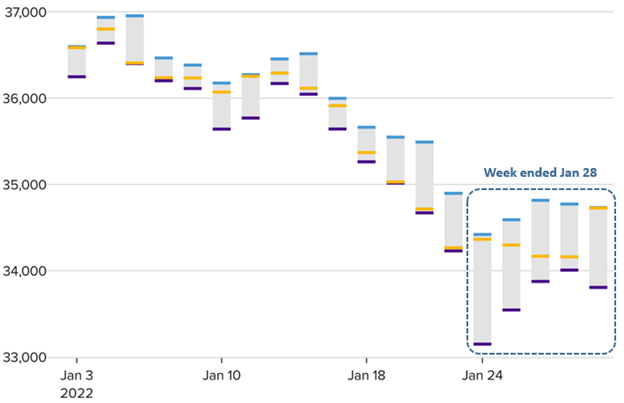
The final sentence of last week’s market missive was “Buckle up, with all those headline producing activities, and investors already jittery, the potential for more choppiness is high.” Well choppy it was! The major U.S. indexes underwent wild swings each day of the week — including the Dow Jones Industrial Average making up a more than 1,000-point intraday deficit for the first time ever to close higher on Monday. According to Bespoke Investment Group, the S&P 500 posted an intraday range of at least 2.25% every day this week. The Nasdaq Composite traded in a 7% range during the week and essentially finished flat. The Cboe VIX Volatility Index had risen for seven straight days before reversing lower on Thursday and Friday. Only 10 times in the past 20 years has it risen that many days in a row.
The Dow’s daily swings
High, Low, and Closing levels for the Dow Jones Industrial Average
Chart: Nate Rattner / CNBC. Source: FactSet. As of January 28, 2022.
Economic Review
- The Federal Open Market Committee (FOMC) concluded its two-day monetary policy meeting, making no change to the Fed funds rate, as was widely expected. However, it hinted at the possibility of its first rate hike since 2018 being around the corner, saying, “With inflation well above 2% and a strong labor market, the committee expects it will soon be appropriate to raise the target range for the federal funds.” The Committee said it expects its balance sheet reduction “will commence after the process of increasing the target range for the federal funds rate has begun.” The FOMC also said it will continue to taper its asset purchases at a rate of $30 billion per month—$20 billion in Treasuries and $10 billion in mortgage-backed securities. Regarding the economy, the Fed stated that activity and employment have continued to strengthen, and that while the sectors most adversely affected by the pandemic have improved in recent months, they continue to be affected by the recent sharp rise in COVID-19 cases. Additionally, it said job gains have been solid and the unemployment rate has declined substantially, while the “supply and demand imbalances related to the pandemic and the reopening of the economy have continued to contribute to elevated levels of inflation.” No updated economic projections were given at this meeting.
- The first look (of three) at Q4 Gross Domestic Product (GDP), the broadest measure of U.S. economic output, showed a quarter-over-quarter annualized rate of expansion of +6.9%, well above expectations for +5.5%, and above the unrevised +2.3% increase in Q3. That resulted in full year GDP growth of +5.5%, which is the fastest full year growth since 1984. Personal Consumption rose by +3.3%, compared to forecasts of +3.4%, and following the unadjusted +2.0% increase recorded in Q3. The Core Personal Consumption Expenditures price index, the Fed’s preferred inflation gauge, jumped +4.9% from the year prior. The Core PCE gain was higher than expectations and the hottest reading since September 1983.
- The December Chicago Fed National Activity Index (CFNAI), which draws on 85 economic indicators, slipped -0.15 versus +0.44 in November (revised up from the original +0.37). A reading below zero indicates below-trend-growth in the national economy and a sign of easing pressures on future inflation. 38 of the 85 monthly individual indicators made positive contributions; 47 made negative contributions.
- The preliminary Markit U.S. Manufacturing Purchase Managers Index (PMI) for January fell to 55.0 from December’s unrevised 57.7, below consensus estimates for a decrease to 56.7. The preliminary Markit U.S. Services PMI showed growth (above 50) for the key U.S. service sector slowed much more than expected, falling to 50.9 from December’s 57.6, well under forecasts for a drop to 55.4. The resulting Composite PMI fell to 50.8, an 18-month low, versus 57 in December.
- The Conference Board’s Consumer Confidence Index fell to 113.8 in January from December’s downwardly revised 115.2, beating expectations of 111.2. The overall index was dragged by the Expectations Index of business conditions for the next six months portion of the index, which fell to 90.8 from December’s 95.4 level, while the Present Situation Index portion of the survey increased to 148.2 from the previous month’s 144.8 level.
- The Richmond Fed Manufacturing Activity Index remained in expansion territory (a reading above zero), but fell to 8 from 16 in December, below expectation for 14.
- The January Kansas City Fed Manufacturing Activity Index moved further into expansion levels (a reading above zero) with a rise to 24 from December’s downwardly revised 22, and compared to expectations for a decrease to 21.0.
- The S&P CoreLogic Case-Shiller National Home Price Index (HPI), which measures average home prices in major metropolitan areas across the nation, rose +18.8% in the year that ended in November, down from a +19% annual rate the prior month. Intense competition for a limited number of homes on the market has pushed prices to record highs. The 20-city HPI showed an +18.3% year-over-year gain, above estimates of an +18.0% rise.
- December New Home Sales surged +11.9% month-over-month to an annual rate of 811,000 units, far above expectations for a rate of 760,000, and above November’s negatively revised 725,000-units. The Median Home Price rose +3.4% year-over-year to $377,700. New Home Inventory fell to 6.0 months from 6.6 months of supply in November. This was the highest level of sales since March 2021 as sales surged in the Midwest and jumped in the South, more than offsetting a drop in the Northeast and relatively flat sales in the West. However, sales in all regions were down solidly year-over-year, except for in the West, which were up modestly.
- December Pending Home Sales fell -3.8%, worse than the estimate for a -0.4% decline and November’s negatively revised -2.3% drop. Sales were down -6.6% on an annual basis, following November’s unadjusted 0.2% gain.
- December Personal Income rose +0.3% month-over-month, below expectations to match November’s upwardly revised +0.5% gain. Personal Spending declined -0.6%, in line with expectations, and compared to the prior month’s downwardly adjusted +0.4% gain. The Savings Rate as a percentage of disposable income was +7.9%, up from November’s upwardly revised +7.2% rate.
- The final January University of Michigan Consumer Sentiment Index was unexpectedly revised lower to 67.2, from the preliminary 68.8 figure, where it was expected to remain. The downward revision came as both the expectations and current conditions portions of the survey were surprisingly adjusted downward. The overall index was below December’s 70.6. The 1-year inflation forecast rose to 4.9% from December’s 4.8% rate, and the 5-10 year inflation forecast also increased to 3.1% from the 2.9% level in the prior month.
- Weekly unemployment claims fell 30,000 to 260,000, below expectations for 265,000, and below the prior week’s upwardly revised level of 290,000. Continuing claims rose 51,000 to 1,675,000, above estimates of 1,653,000.
The Week Ahead
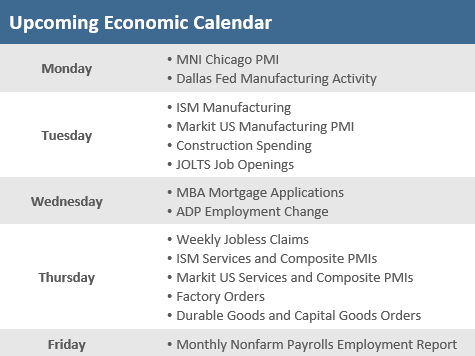
After a wild week of sharp reversals, stocks are likely to remain volatile in the week ahead as the earning parade rolls on with dozens of high-profile firms reporting like Alphabet, Amazon, and Exxon Mobil. Bristol-Myers Squibb and Merck report, as do Ford and General Motors. The week is also busy with economic releases, with ISM and Markit PMIs, JOLTS Job Openings, and Factory Orders, but the most important comes on Friday with the January employment report.
Did You Know?
OFFSIDES? — Thanks to a long bull market that surprisingly rose and rose through the pandemic, plus more than a decade of low yields for bonds, older Americans have a lot of money in the stock market. Data from Fidelity Investments’ 20.4 million 401(k) investors shows that almost 40% of 401(k) investors age 60 to 69 hold about 67% or more of their portfolios in stocks (source: The Wall Street Journal).
UP/DOWN — The S&P 500 index has been up 40 of the last 50 calendar years, i.e., 1972-2021, gaining an average of +11.1% per year (total return). The stock index has produced an average annual gain of +18.8% (total return) during the 40 “up” years while losing an average of 8% per year (total return) during the 10 “down” years (source: BTN Research).
AND MAYBE NOT DONE YET — In 2008-2009, Congress authorized spending of $983 billion to alleviate the impact of the global mortgage crisis, an amount equal to 6% of the size of the $15.2 trillion US economy. In 2020-2021, Congress authorized spending of $5.73 trillion to alleviate the impact of the global pandemic, an amount equal to 25% of the size of the $23.2 trillion US economy (source: Committee for a Responsible Federal Budget, BTN Research).
This Week in History
On January 24 in 1848, workers dredging a stream to speed up the water flow into the sluiceway of John Sutter’s sawmill in Coloma, Calif., struck a bed of soft yellow rock. James W. Marshall, scooping up a dozen pure gold nuggets in his wool top hat, exclaimed, “Boys, I’ve got ‘er now!” The California gold rush was on (source: The Wall Street Journal).
Asset Class Performance
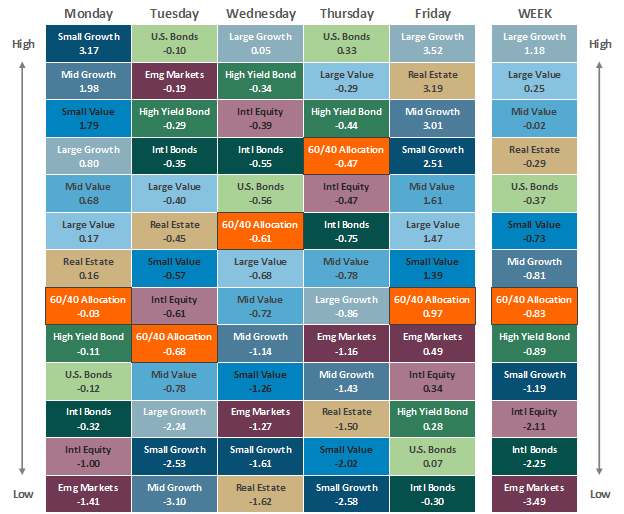
The Importance of Diversification. Diversification mitigates the risk of relying on any single investment and offers a host of long-term benefits, such as lowering portfolio volatility, improving risk-adjusted returns, and helping investments to compound more effectively.
Source: Bloomberg. Asset‐class performance is presented by using market returns from an exchange‐traded fund (ETF) proxy that best represents its respective broad asset class. Returns shown are net of fund fees for and do not necessarily represent the performance of specific mutual funds and/or exchange-traded funds recommended by The Retirement Planning Group. The performance of those funds may be substantially different than the performance of the broad asset classes and to proxy ETFs represented here. U.S. Bonds (iShares Core U.S. Aggregate Bond ETF); High‐Yield Bond (iShares iBoxx $ High Yield Corporate Bond ETF); Intl Bonds (SPDR® Bloomberg Barclays International Corporate Bond ETF); Large Growth (iShares Russell 1000 Growth ETF); Large Value (iShares Russell 1000 Value ETF); Mid Growth (iShares Russell Mid-Cap Growth ETF); Mid Value (iShares Russell Mid-Cap Value ETF); Small Growth (iShares Russell 2000 Growth ETF); Small Value (iShares Russell 2000 Value ETF); Intl Equity (iShares MSCI EAFE ETF); Emg Markets (iShares MSCI Emerging Markets ETF); and Real Estate (iShares U.S. Real Estate ETF). The return displayed as “Allocation” is a weighted average of the ETF proxies shown as represented by: 30% U.S. Bonds, 5% International Bonds, 5% High Yield Bonds, 10% Large Growth, 10% Large Value, 4% Mid Growth, 4% Mid Value, 2% Small Growth, 2% Small Value, 18% International Stock, 7% Emerging Markets, 3% Real Estate.
Chris Bouffard is CIO of The Retirement Planning Group (TRPG), a Registered Investment Adviser. He has oversight of investments for the advisory services offered through TRPG.
Disclaimer: Information provided is for educational purposes only and does not constitute investment, legal or tax advice. All examples are hypothetical and for illustrative purposes only. Past performance of any market results is no assurance of future performance. The information contained herein has been obtained from sources deemed reliable but is not guaranteed. Please contact TRPG for more complete information based on your personal circumstances and to obtain personal individual investment advice.


