Quick Takes
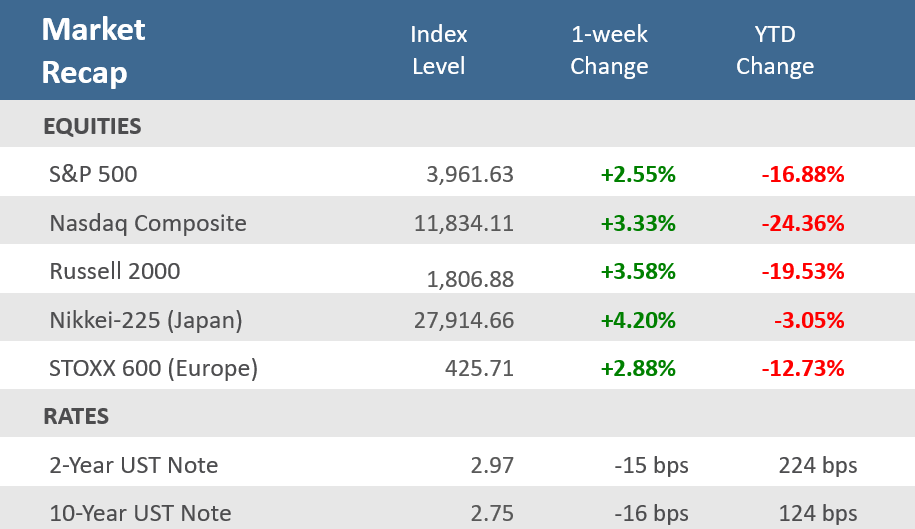
- In a bit of a reversal from the prior week, stocks rallied nicely for the week but gave back some of their gains on Friday. Despite Friday’s pullback, the S&P 500 up +2.6% for the week, while the Nasdaq Composite gained +3.3%, and the small cap Russell 2000 was up +3.6%. All the indices were able to move back above their 50-day moving averages.
- The yield on the 2-year U.S. Treasury and 10-year U.S. Treasury were down -15 bps and -16 bps respectively, and the Bloomberg U.S. Aggregate Bond Index was up +1.2%, its second straight positive week, and its fourth positive week in the last five. The index is up +1.8% for July which would be its best month since February 2020.
- The economic data was rather light and dominated by housing reports, and just about everything came in weaker than expected. Builder sentiment plunged, housing starts and existing home sales were soft, and building permits fell in all regions. Outside of housing, the preliminary Services PMI unexpectedly fell into contraction territory.
Stocks post solid gains despite soft economic data.
Financial markets rallied most of the week but gave back some ground on Friday… a bit of a reversal from the prior week’s action. Despite the pullback Friday, it was a solid week of gains for stocks with the S&P 500 up +2.6%, the Nasdaq Composite up +3.3%, and the small cap Russell 2000 up +3.6%. In a sign of the broad strength of the week’s rally, all the indices were able to move above their 50-day moving averages – a key technical and psychological level for many investors. The S&P 500 looks to be on the way to what would be its fourth oversold relief rally of approximately +10% this year, currently up about +8% from its mid-June lows. Unlike the prior rallies, the current rally has coincided with a meaningful pullback in commodity prices and longer-term interest rates. The 10-year US Treasury yield has fallen from +3.5% to +2.75 during this rally. The 2-year closed at 2.97%, so that part of the yield curve remains inverted. The fed funds futures market swung around quite a bit all week but settled at an 80% probability that the Federal Reserve’s policy-making committee lifts the benchmark rate by 0.75 percentage points on Wednesday. Markets appear to be anticipating that slowing economic growth and rising recession risks will keep the Fed from significantly tightening monetary policy much beyond year-end.
Speaking of slowing growth, the rally in stocks overshadowed what was a rather weak week for economic data. Homebuilder sentiment had its biggest drop on record outside of the April 2020 pandemic reading. Housing starts were weaker than expected and building permits fell in every region. Existing home sales were weaker than expected and declined for the fifth straight month. Initial jobless claims topped 250,000 for the first time since mid-November 2021. The June Leading Economic Index fell for the fourth consecutive month, prompting the Conference Board to suggest that a U.S. recession around the end of this year and early next year is now likely. And the preliminary July S&P Global U.S. Services PMI Index unexpectedly fell into contraction. The Federal Reserve Bank of Atlanta’s GDPNow model, which predicts GDP growth in real time, forecasts the US economy will shrink -1.6% in the second quarter. That would be the second consecutive negative quarterly GDP print which many consider to mean the economy is in recession. The Bureau of Economic Analysis releases its initial report for Q2-2022 GDP on Thursday, July 28.
Earnings season is jumping into high gear in the upcoming week, and with about 21% of the constituents of the S&P 500 Index having reported for Q2-2022, blended earnings per share (which combines reported data with estimates for those that have yet to report) shows that earnings growth is running at +5% compared with the same quarter a year ago, while sales rose +10.7%. With clear signs of slower growth, several financial services and technology companies announced hiring slowdowns or freezes on recent earnings calls.
Chart of the Week
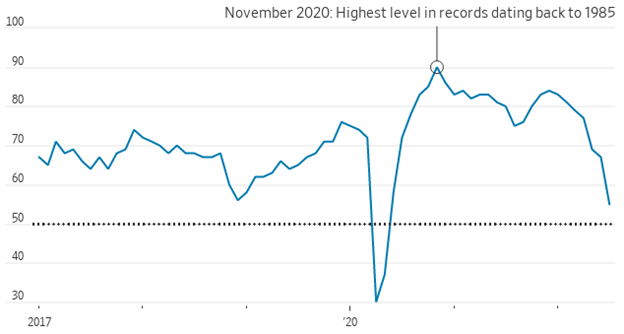
U.S. builder confidence is plunging as mortgage rates and construction costs rise and sales fall. The National Association of Home Builders (NAHB) Housing Market Index (HMI) fell in July for the seventh straight month after posting its second-largest single-month drop on record. Homebuilder sentiment fell to 55 in July—the lowest since May 2020—from an unrevised 67 in June and well below expectations for a dip to 65. The NAHB said, “Affordability is the greatest challenge facing the housing market.” Also, the report said, “production bottlenecks, rising home building costs and high inflation are causing many builders to halt construction because the cost of land, construction, and financing exceeds the market value of the home.
U.S. builder confidence is plunging due to rising mortgage rates
National Association of Home Builders housing market index.
Note: Any number over 50 indicates that more builders view conditions as good than poor.
Source: NAHB, The Wall Street Journal
Economic Review
- The preliminary S&P Global U.S. Manufacturing PMI Index for July fell to 52.3 from June’s unrevised 52.7 but was better than expectations for 52.0. The preliminary S&P Global U.S. Services PMI Index unexpectedly fell into contraction territory, dropping to 47.0, far below expectations to remain at June’s 52.7. Readings of 50 denote the point between expansion and contraction. S&P Global said its Composite PMI—a combination of the manufacturing and services—saw the first contraction in business activity since June 2020, signaling a further loss of momentum across the economy to a degree not seen—outside of COVID-19 lockdowns—since 2009.
- The Conference Board’s Leading Economic Index (LEI) for June fell -0.8% for the month, worse than expectations to match May’s downwardly revised -0.6% drop, and its fourth negative month in a row as consumer expectations, stock prices, jobless claims, average workweek, and ISM new orders all detracted, and more than offsetting gains for the interest rate spread, and credit conditions.
- The July Philly Fed Manufacturing Business Outlook Index unexpectedly fell further into contraction territory (a reading below zero) dropping to -12.3 versus expectations of an increase to +0.8 from -3.3 in June.
- June Housing Starts fell -2.0% for the month to an annual pace of 1,559,000 units, below expectations for a rise to 1,580,000 units and May’s upwardly revised 1,591,000 units. Building Permits, one of the leading indicators tracked by the Conference Board, fell by -0.6% for the month to an annual rate of 1,685,000, above expectations for 1,650,000 units, but below the unrevised 1,695,000 units in May.
- June Existing Home Sales fell -5.4% for the month to an annual rate of 5.12 million units, the lowest since June 2020, and under expectations for a 5.35 million rate, while May’s data remained unrevised at 5.41 million units. Contract closings fell for the fifth-straight month as sales in the Midwest, South, and West were all lower for the month, while sales in the Northeast were unchanged. Compared to last year, sales were lower in all regions. The median existing-home price was up +13.4% from a year ago to a record high of $416,000 and is up for 124 straight months as prices rose in each region. Unsold inventory was at a 3.0-months pace at the current sales rate, up from the 2.5-months pace a year earlier.
- The weekly MBA Mortgage Application Index fell by -6.3% following the prior week’s -1.7% decline and marked the third consecutive week of declines. The Refinance Index fell -4.3% from last week while the Purchase Index was down -7.3% for the week. The declines came as the average 30-year mortgage rate rose 8 basis points to 5.82%, and up +27 bps from last year.
- Weekly Initial Jobless Claims were 251,000, for the week ended July 16, above expectations for 240,000, and the prior week’s unrevised 241,000. Continuing Claims for the week ended July 9 were up 51,000 to 1,384,000, above expectations of 1,340,000.
The Week Ahead
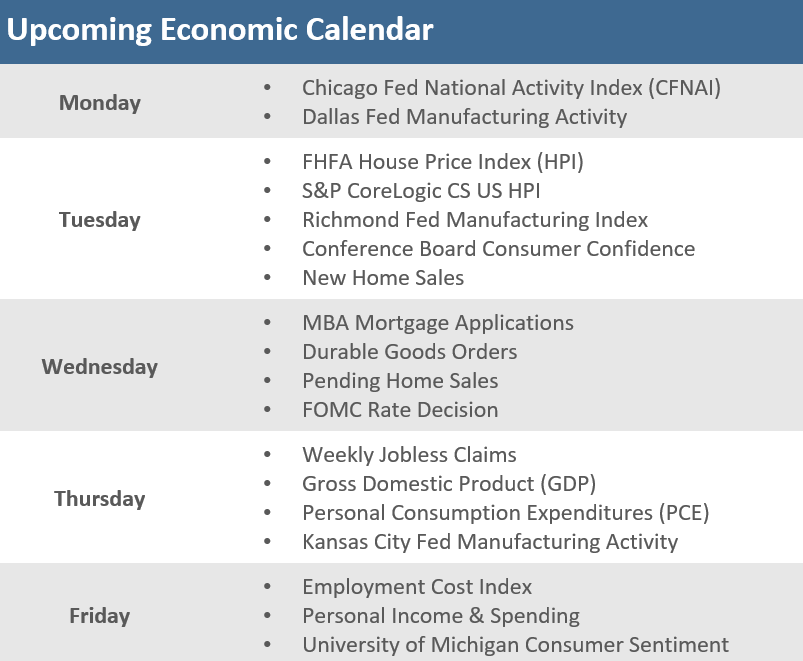
From famine to feast… the economic calendar transitions from a sparse week of activity to what may be perhaps the busiest and most important of the summer. The week will be headlined by the Federal Open Market Committee’s (FOMC) monetary policy decision on July 27 in which the FOMC is expected to raise the fed funds rate by 75 bps for a second-straight meeting. In addition, the week brings the first look (of three) at second quarter GDP, personal income, and spending figures for June, July Consumer Confidence, and preliminary June durable goods orders. If that wasn’t enough, more than 50% of the S&P 500 companies will be reporting earnings, including a who’s who of giant cap tech with AAPL, MSFT, AMZN, GOOG, and META (formerly Facebook).
Did You Know?
CHANGE FROM Q.E. TO Q.T. – The Federal Reserve began a reversal of “Quantitative Easing” on 6/15/2022 with its program of “Quantitative Tightening,” i.e., changing from monthly purchases of $120 billion of bonds to a monthly runoff of $95 billion of bonds. Fed analysis suggests that every $1 trillion reduction of bonds from the Fed’s $8.5 trillion balance sheet would have the same impact as a 0.20 percentage point increase in interest rates (source: Federal Reserve, BTN Research).
YOU DON’T GET IT – If you were born on 12/31/1941, by the time you turned 40 years old on 12/31/1981, you had lived through 9 calendar years with at least +7% inflation (as measured by the Consumer Price Index, aka CPI). If you were born on 12/31/1981, by the time you turned 40 years old on 12/31/2021, you had lived through just 1 calendar year with at least +7% inflation, i.e., +7.0% in the calendar year 2021 (source: Department of Labor, BTN Research).
INDICATOR OF WHAT? – The price of copper peaked at $4.92 per pound on Saturday 3/05/2022 but has since fallen 34% to $3.23 per pound on Thursday 7/14/2022. Copper is used in nearly all household appliances, automobiles, and in HVAC systems (source: MoneyMetals.com, BTN Research).
This Week in History
NOT QUITE TO THE MOON – On July 20, 1969, Neil Armstrong became the first human to walk on the moon. Stocks didn’t go into orbit during the week, but the S&P 500 and Nasdaq did manage to finally break back above their 50-day moving averages, ending, for the S&P 500, what was the longest streak under its 50-day moving average since the Financial Crisis (source: Bespoke Investment Group).
Asset Class Performance
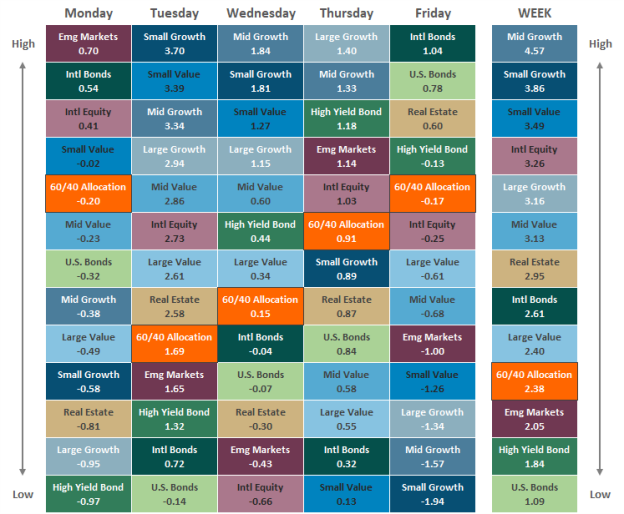
The Importance of Diversification. Diversification mitigates the risk of relying on any single investment and offers a host of long-term benefits, such as lowering portfolio volatility, improving risk-adjusted returns, and helping investments to compound more effectively.
Source: Bloomberg. Asset‐class performance is presented by using market returns from an exchange‐traded fund (ETF) proxy that best represents its respective broad asset class. Returns shown are net of fund fees for and do not necessarily represent the performance of specific mutual funds and/or exchange-traded funds recommended by The Retirement Planning Group. The performance of those funds may be substantially different than the performance of the broad asset classes and to proxy ETFs represented here. U.S. Bonds (iShares Core U.S. Aggregate Bond ETF); High‐Yield Bond (iShares iBoxx $ High Yield Corporate Bond ETF); Intl Bonds (SPDR® Bloomberg Barclays International Corporate Bond ETF); Large Growth (iShares Russell 1000 Growth ETF); Large Value (iShares Russell 1000 Value ETF); Mid Growth (iShares Russell Mid-Cap Growth ETF); Mid Value (iShares Russell Mid-Cap Value ETF); Small Growth (iShares Russell 2000 Growth ETF); Small Value (iShares Russell 2000 Value ETF); Intl Equity (iShares MSCI EAFE ETF); Emg Markets (iShares MSCI Emerging Markets ETF); and Real Estate (iShares U.S. Real Estate ETF). The return displayed as “Allocation” is a weighted average of the ETF proxies shown as represented by: 30% U.S. Bonds, 5% International Bonds, 5% High Yield Bonds, 10% Large Growth, 10% Large Value, 4% Mid Growth, 4% Mid Value, 2% Small Growth, 2% Small Value, 18% International Stock, 7% Emerging Markets, 3% Real Estate.
Chris Bouffard is CIO of The Retirement Planning Group (TRPG), a Registered Investment Adviser. He has oversight of investments for the advisory services offered through TRPG.
Disclaimer: Information provided is for educational purposes only and does not constitute investment, legal or tax advice. All examples are hypothetical and for illustrative purposes only. Past performance of any market results is no assurance of future performance. The information contained herein has been obtained from sources deemed reliable but is not guaranteed. Please contact TRPG for more complete information based on your personal circumstances and to obtain personal individual investment advice.


