Quick Takes
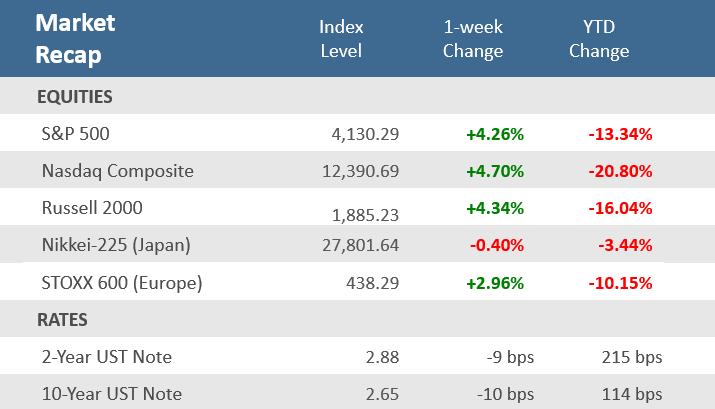
- Global stocks and bonds shrugged off softening economic data to put in solid gains for the final week of July. Stocks were up for the second straight week and the third week in the last four. The S&P 500 advanced +4.3%, the small cap Russell 2000 Index was up +4.7%, and the technology-heavy Nasdaq Composite gained +4.7%.
- The yield on the U.S. 10-year Treasury Note trimmed another 10 basis points (bps) to fall back to 2.65%, its lowest level since April. As a result, the Bloomberg Aggregate Bond Index was up +0.6%, its third consecutive weekly gain, and the fifth positive week in the last six.
- The first look at Q2 GDP showed the economy contracted for the second-consecutive quarter, sparking debate about whether the U.S. economy is in recession. The Fed hiked rates a second-straight 75 bps, and Fed Chairman Jerome Powell said future hikes would be data-driven but didn’t feel the U.S. economy is in recession.
Recession or not, capital markets continue to rebound
Global stocks and bonds shrugged off softening economic data to put in solid gains for the final week of July. Stocks were up for the second straight week and the third week in the last four. The S&P 500 advanced +4.3%, the small cap Russell 2000 Index was up +4.7%, and the technology-heavy Nasdaq Composite gained +4.7%.
It wasn’t just stocks that kept up their winning ways, bonds rallied too. The yield on the U.S. 10-year Treasury Note trimmed another 10 basis points (bps) to fall back to 2.65%, its lowest level since April. As a result, the Bloomberg Aggregate Bond Index was up +0.6%, its third consecutive weekly gain, and the fifth positive week in the last six.
Investors looked past concerns about high inflation and a recessionary environment, a stark contrast to the first six months of the year. In fact, markets are indicating that inflation may have peaked and therefore the Federal Reserve’s aggressive pace of interest rate hikes may slow going forward. During the week, the Fed announced a second-straight 75 bps rate hike, but Fed Chairman Jerome Powell’s comments after the rate decision appeared to calm concerns about an overly aggressive Fed. Powell said that the September rate decision (there is no August meeting) will depend on economic data. According to the Fed, rates are now “right in the range” of “neutral” (i.e., an interest rate that neither hinders nor fuels economic growth).
Lately, the economic data has softened noticeably. As discussed further in the Chart of the Week section below, recession chatter really picked up after the first look at Q2 GDP showed the economy contracted for the second-consecutive quarter. It’s not just economic growth that has slowed, the housing and labor markets are also now showing signs of softening. Initial jobless claims have been trending higher since bottoming at 166,000 in March, and the past week saw new and pending home sales fall to some of the lowest levels since April 2020 while mortgage applications have declined for four straight weeks.
Earnings may be one of the factors keeping markets afloat. Second quarter earnings results are largely coming in better than expected, although the headwinds facing the economy—inflation, supply chains, labor costs, the U.S. dollar, and the consumer—were cited frequently in the reports and guidance. We are a little past the halfway point of this earnings season, with 56% of S&P 500 companies having reported already and the number of S&P 500 companies reporting positive earnings surprises continued to rise over the prior week which help improve the growth rate for Q2. According to FactSet, of the companies reported, 73% have been above estimates, greater than last week’s 68%, yet still below the five-year average of 77%. The blended earnings growth rate (which combines actual results for companies that have reported and estimated results for companies that have yet to report) for the second quarter is now 6.0%, compared to 4.7% the prior week and just 4.0% at the end of the second quarter (June 30).
Chart of the Week
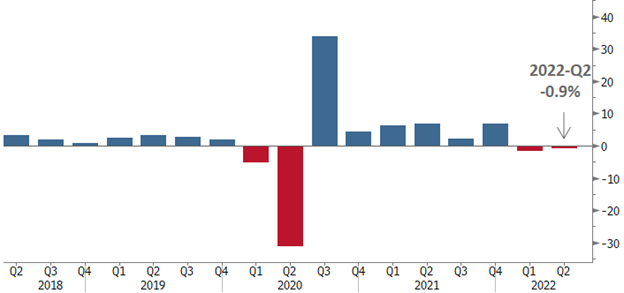
The first look (of three) at 2022-Q2 Gross Domestic Product (GDP), the broadest measure of economic output that includes the total level of goods and services produced, showed that the U.S. economy contracted quarter-over-quarter at a -0.9% annualized rate, well under expectations for growth of +0.4%. It was the second consecutive negative quarter of GDP after the unrevised -1.6% decrease in Q1, marking a long-held and widely accepted technical rule for a recession. Officially, the National Bureau of Economic Research declares recessions and expansions, but they likely won’t decide for months, if not longer. The broad-based decline in GDP came from a wide range of factors, including decreases in inventories, residential and nonresidential investment, and government spending at the federal, state, and local levels. Looking at the details beyond the headline rate, Personal Consumption Expenditures (PCE) rose just +1.0%, in light of expectations for a +1.2% gain, and below the unrevised +1.8% increase in Q1. That was the weakest growth in consumer spending since Q2-2020. Regarding inflation, the GDP Price Index came in at an +8.7% increase, well above expectations of +8.0%, and the unrevised +8.2% rise seen in Q1. It was the largest increase since Q1-1981. A key takeaway from the report is that it will stir the debate as to whether the U.S. economy is in recession or not, but the results leave little debate about the economic environment; it has slowed considerably.
U.S. Economy Contracts for Second-Straight Quarter
Quarterly change in U.S. Gross Domestic Product (GDP)
Note: Seasonally adjusted at annual rates.
Source: Bureau of Economic Analysis, Bloomberg
Economic Review
- The Chicago National Activity Index (CFNAI) held at -0.19 in June, the first back-to-back negative readings since the pandemic started in early 2020. The index is comprised of 85 individual indicators covering four broad U.S. economic categories. In June, 41 of the 85 made a positive contribution while 44 made negative contributions.
- June preliminary Durable Goods Orders rose +1.9% for the month, well ahead of expectations for a -0.4% decrease and above May’s unrevised +0.8%. Ex-transportation, orders were up +0.3%, a bit above expectations for +0.2% but below May’s downwardly revised +0.5%. Orders for non-defense capital goods excluding aircraft, considered a proxy for business spending, rose +0.5%, beating expectations for a +0.2% rise, and in line with May’s downwardly revised +0.5% gain.
- The Dallas Fed Manufacturing Index dropped further into contraction territory (a reading below zero) in July. The index fell to -22.6 from -17.7 in June, worse than expectations for -18.5. The index hit the lowest in two years as new orders and general business activity both contracted at an accelerated pace, while the outlook for companies remained in contraction territory, along with the growth rate of orders.
- The July Richmond Fed Manufacturing Activity Index surprisingly increased into neutral territory (a reading below zero denotes contraction, while a reading above zero denotes expansion), jumping to 0 from -11 in June, and well above forecasts for a reading of -14. New order volume improved but is still at contraction levels, but shipments rose to expansion territory, while prices paid decelerated slightly but remained elevated.
- The July Kansas City Fed Manufacturing Activity Index unexpectedly moved further into expansion territory (a reading above zero), rising to 13 from June’s unrevised 12, well above expectations for a decline to 4.
- The July Conference Board’s Consumer Confidence Index fell to 95.7 from June’s downwardly revised 98.4, below expectations of 97.0. That was the third straight monthly decline and brings consumer confidence to the lowest level since February 2021. The Expectations Index of business conditions for the next six months portion of the index, fell to 65.3 from 65.8 in June, while the Present Situation Index component fell to 141.3 from 147.2 in June. On employment, the labor differential—consumers’ appraisal of jobs being “plentiful” minus being “hard to get”—decreased to 37.8 from 39.9 in June. According to Lynn Franco, senior director of economic indicators at The Conference Board, “concerns about inflation—rising gas and food prices, in particular—continued to weigh on consumers.”
- The final July University of Michigan Consumer Sentiment Index was revised up to 51.5, from the preliminary 51.1, where it was expected to remain. The upward revision came as the Current Conditions portion of the survey was adjusted higher, while the Expectations Component remained unchanged from the preliminary estimate. The overall index is up from June’s record low of 50.0. The 1-year inflation forecast was unchanged and in line with expectations at +5.2%, and down from +5% in June. The 5-10 year inflation forecast was revised slightly higher to +2.9%, from the preliminary +2.8%, where it was expected to remain, and below June’s +3.1% rate.
- June Personal Income rose +0.6%, beating expectations for a +0.5% gain, and matching May’s upwardly revised increase. Personal Spending increased +1.1%, above expectations of +1.0%, and May’s upwardly revised +0.3%. The June Personal Savings Rate as a percentage of disposable income was +5.1%, down from May’s upwardly revised +5.5%, suggesting that consumers are spending savings to fight the effects of high inflation.
- The PCE Price Index matched expectations with a +6.8% rise, up from a +6.3% gain in May, and marking the largest annual increase since a +6.9% increase in January 1982. A gauge the Fed follows closely, the Core PCE Price Index, which excludes food and energy, rose +4.8%, also in line with expectations, and down from the unrevised +5.2% gain in Q1. Although the Fed generally focus more on Core PCE, they have paid increasing attention lately to the headline PCE with the surge in food and energy prices in 2022. Fortunately, those prices have retreated recently.
- The Employment Cost Index (ECI), another figure Fed policymakers follow closely, rose +1.3% in the second quarter, a slight decline from the unrevised +1.4% gain in Q1, but was ahead of expectations for +1.1%. Annually, the ECI was up +5.1% which was a record for the data series that goes back to the first quarter of 2002. The Fed follows the ECI figures because they measure the change in the cost of labor but are free from the influence of employment shifts across occupations and industries because they adjust for imbalances between gains from higher- and lower-wage workers, as well as other factors.
- June New Home Sales fell -8.1% to an annual rate of 590,000 units, well below expectations for 655,000 units, and below May’s downwardly revised 642,000 units. That was the lowest seasonally adjusted annual rate since April 2020. The median home price rose +7.4% to $402,400, up 7.4% from a year earlier but down 9.5% from the prior month. New home inventory increased to 9.3 months of supply from 7.7 months in May. Sales only rose in the Midwest and fell in the Northeast, South, and West. Sales were lower on an annual basis in all regions.
- June Pending Home Sales fell -8.6% for the month, the largest monthly decline since April 2020 and a much bigger decline than expectations for -1.0%. It was also well below May’s downwardly revised -0.4% fall. Sales tumbled -19.8% on an annual basis following May’s downwardly revised -12.3% drop. The June results show the impact of the drop in housing affordability this year as home prices and mortgage rates have risen materially.
- The S&P CoreLogic Case-Shiller National Home Price Index, which measures average home prices in major metropolitan areas across the nation, rose +19.7% in the year ended in May, down from +20.6% the prior month.
- The weekly MBA Mortgage Application Index fell -1.8% following the prior week’s -6.3% decline and marked the fourth consecutive week of declines. The Refinance Index fell -3.7% from last week while the Purchase Index was down -0.8% for the week. The declines came as the average 30-year mortgage rate fell 8 basis points to 5.74% but is up +273bps from last year.
- Weekly Initial Jobless Claims were 256,000, for the week ended July 23, above expectations for 250,000, and the prior week’s 261,000, revised up from 251,000. Continuing Claims for the week ended July 16 dipped 25,000 to 1,359,000, below expectations of 1,386,000.
The Week Ahead
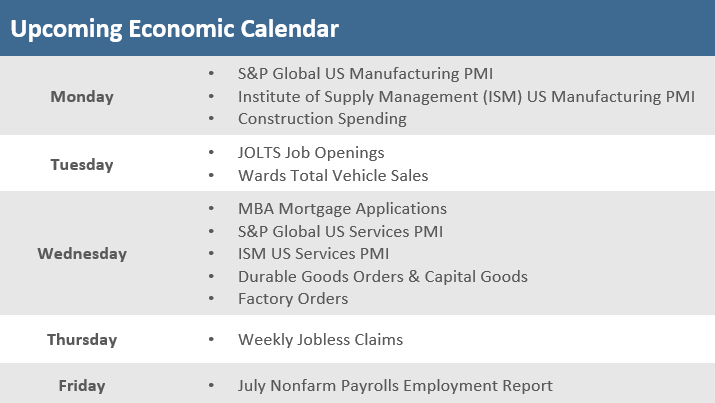
The economic calendar moves to July manufacturing and services PMIs from S&P Global and ISM, but also so big labor market reports with the JOLTS Job Openings, ADP’s private sector employment survey, and the big Nonfarm Payrolls and Employment Report on Friday that is expected to show the economy added 250,000 jobs in July. It will also be another heavy week of earnings, with 148 S&P 500 companies set to report. Several Fed officials will also be speaking and may make headlines, highlighted by the hawkish James Bullard, President of the St. Louis Fed.
Did You Know?
COLA CHANGES – The “cost of living adjustment” (COLA) made to Social Security benefits is calculated based upon the year-over-year increase in prices from the 3rd quarter of subsequent years. The COLA that will be applied to benefits paid in January 2023 will be based on the change of prices from the end of the 3rd quarter 2021 to the end of the 3rd quarter 2022. The COLA increase implemented at the start of 2022 was +5.9%, Social Security’s largest increase since 1982 (source: Social Security, BTN Research).
ZOMBIES – An estimated 1 out of every 6 companies (17%) domiciled in industrialized economies worldwide have been able to stay in business throughout the pandemic (and avoid bankruptcy) to a great degree because of the low-interest rate debt that was made available to them (source: Committee on the Global Financial System, BTN Research).
FRIENDLIER SKIES – The average airfare for round-trip domestic flights this fall has dropped to $298, according to data from the travel booking app Hopper. That’s down from May when average fares exceeded $400. Overall, domestic flights are roughly -26% cheaper this fall compared with the peak cost for summer airfare. Normally, prices for plane tickets drop between -10% and -15% as children go back to school (source: The Wall Street Journal).
This Week in History
AN INDEX FUND IS BORN – On July 28, 1971, Wells Fargo launched the world’s first stock-index fund with $6 million from the pension fund of Samsonite. The trader executing the orders for the new fund immediately acquired the sarcastic nickname “Discount Diane” (source: The Wall Street Journal).
Asset Class Performance
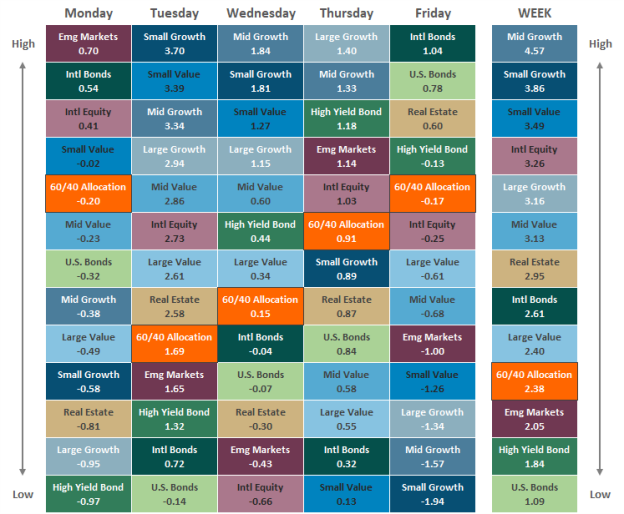
The Importance of Diversification. Diversification mitigates the risk of relying on any single investment and offers a host of long-term benefits, such as lowering portfolio volatility, improving risk-adjusted returns, and helping investments to compound more effectively.
Source: Bloomberg. Asset‐class performance is presented by using market returns from an exchange‐traded fund (ETF) proxy that best represents its respective broad asset class. Returns shown are net of fund fees for and do not necessarily represent the performance of specific mutual funds and/or exchange-traded funds recommended by The Retirement Planning Group. The performance of those funds may be substantially different than the performance of the broad asset classes and to proxy ETFs represented here. U.S. Bonds (iShares Core U.S. Aggregate Bond ETF); High‐Yield Bond (iShares iBoxx $ High Yield Corporate Bond ETF); Intl Bonds (SPDR® Bloomberg Barclays International Corporate Bond ETF); Large Growth (iShares Russell 1000 Growth ETF); Large Value (iShares Russell 1000 Value ETF); Mid Growth (iShares Russell Mid-Cap Growth ETF); Mid Value (iShares Russell Mid-Cap Value ETF); Small Growth (iShares Russell 2000 Growth ETF); Small Value (iShares Russell 2000 Value ETF); Intl Equity (iShares MSCI EAFE ETF); Emg Markets (iShares MSCI Emerging Markets ETF); and Real Estate (iShares U.S. Real Estate ETF). The return displayed as “Allocation” is a weighted average of the ETF proxies shown as represented by: 30% U.S. Bonds, 5% International Bonds, 5% High Yield Bonds, 10% Large Growth, 10% Large Value, 4% Mid Growth, 4% Mid Value, 2% Small Growth, 2% Small Value, 18% International Stock, 7% Emerging Markets, 3% Real Estate.
Chris Bouffard is CIO of The Retirement Planning Group (TRPG), a Registered Investment Adviser. He has oversight of investments for the advisory services offered through TRPG.
Disclaimer: Information provided is for educational purposes only and does not constitute investment, legal or tax advice. All examples are hypothetical and for illustrative purposes only. Past performance of any market results is no assurance of future performance. The information contained herein has been obtained from sources deemed reliable but is not guaranteed. Please contact TRPG for more complete information based on your personal circumstances and to obtain personal individual investment advice.


