Quick Takes
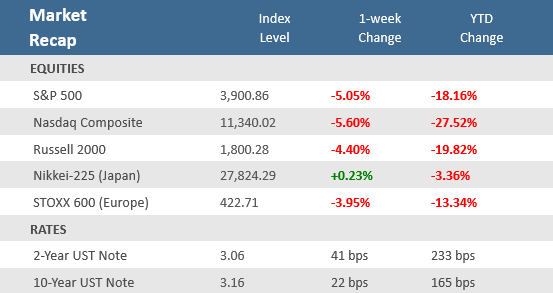
- The S&P 500 and Nasdaq Composite lost 5.1% and 5.6%, respectively, for their ninth losing week in 10 and the worst week since January, following a deep and broad-based selloff on Friday as investors reacted to the highest inflation in four decades and the lowest consumer sentiment in the history of the data.
- Bond markets appeared to be preparing for more aggressive monetary policy from the Federal Reserve as inflation continues to rise. The 2-year Treasury yield, which is seen as one of the most sensitive to Fed rate hikes, jumped above 3% on Friday to hit its highest level since 2008. It now sits just 10 basis points behind the 10-year Treasury yield.
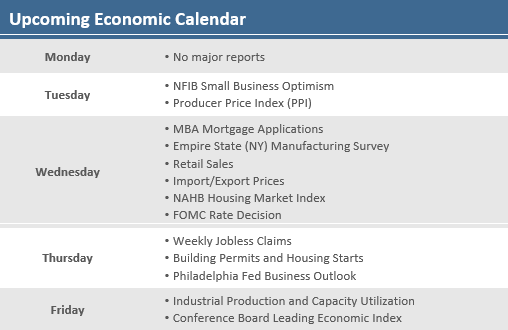
- The Federal Open Mark Committee’s (FOMC) monetary policy decision is slated for Wednesday, and it is largely expected that the Fed will raise rates another 0.5%, followed by a similar increase in July, but the higher-than-expected inflation data could pressure Fed officials to take a more aggressive monetary tightening path.
Persistently high inflation has stock market retesting May lows
The stock market had its worst week since January as U.S. inflation accelerated to a four decade high, fueled by surging gasoline prices, while consumer sentiment plunged to an all-time low. The combination of reports triggered concerns that the hotter-than-expected inflation could mean more aggressive interest rate policy from the Federal Reserve starting at Wednesday’s FOMC meeting, and heightened recession fears. The two key economic reports came on Friday and sparked a broad-based selloff with declining stocks outnumbering advancing stocks on the New York Stock Exchange by a substantial 8 to 1. For the week, it was the worst showing for stocks since January, with the S&P 500 falling -5% and the tech-heavy Nasdaq Composite sinking -5.6%, their ninth losing week in the last ten. The small cap Russell 2000 Index faired a little better but was still down -4.4%.
The national average price of gasoline has exceeded $5.00 per gallon, according to GasBuddy, an industry consultant that surveys prices at more than 150,000 fuel stations nationwide. The average from the American Automobile Association (AAA) is also likely to reach that level this weekend, with prices standing at $4.986 per gallon as of early Friday. With the added pressure on the Fed to get tougher on inflation, bond yields surged. The 2-year Treasury yield, which is seen as one of the most sensitive to Fed rate hikes, jumped above 3% on Friday to hit its highest level since 2008. It now sits just 10 basis points behind the 10-year Treasury yield, which closed the week at 3.16%. The Bloomberg Aggregate Bond Index fell -1.5% during the week, putting it back in correction territory for 2022 at -10.7%.
It’s not just the U.S. struggling with surging inflation. Several other central banks around the world hiked rates this week in response to accelerating prices. The Reserve Bank of India raised rates +0.50% to 4.9%, the Reserve Bank of Australia raised them by +0.50% to 0.85%, and the Central Bank of Chile raised them by +1.5% to 5.5%, which was the central bank’s largest hike in 20 years. The World Bank this week cited several years of rising inflation as part of its reasoning for lowering expected global growth down to 2.9% this year, down from a January forecast of 4.1%. The OECD also cut its global growth view, to 3% from an earlier 4.5% projection. Inflation in member countries should reach 8.5% this year before slipping back to 6% next year, the organization said.
Chart of the Week
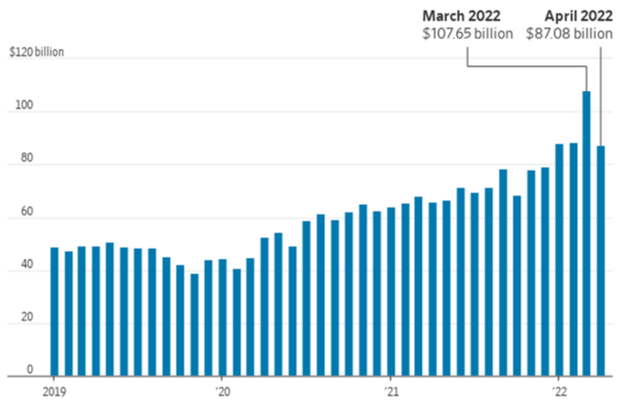
The Commerce Department reported that the April deficit shrunk more than expected, falling -19.1% to a seasonally adjusted $87.1 billion, from March’s downwardly revised record deficit of $107.7 billion, and well under economists’ expectations for a decrease to $89.5 billion. A sharp drop in imports as a result of reduced domestic demand for foreign goods and materials was a primary contributor to the deficit’s decline. Imports in April decreased -3.4%, the first month-on-month decline since July last year, driven by a drop in finished metal, computers, clothing, household goods, toys and pharmaceutical products. Meanwhile exports rose +3.5%.
U.S. Trade Deficit Declines -19%
A big decrease in imports helped cut the trade deficit in April
Source: Census Bureau, The Wall Street Journal.
Economic Review
- The Labor Department on Friday that the Consumer Price Index (CPI) rose +1.0% for the month of May, above expectations of +0.7%, and April’s unrevised +0.3%. Compared to last year, the headline CPI was up +8.6%, a four decade high, and above expectations for it to match April’s unrevised +8.3% rise. Much of the consumer inflation increase came from the substantial increase in the price of gasoline. Core CPI, which excludes food and energy components, increased a smaller +0.6% in May, still above expectations for +0.5%, but unchanged from April’s unadjusted increase. Year-over-year Core CPI was up +6.0%, above expectations of +5.9%, but below April’s unrevised +6.2%.
- Not surprisingly, the rising inflationary burdens has consumers in a sour mood. The June preliminary University of Michigan Consumer Sentiment Index fell to 50.2, far below expectations for slight decrease of 58.1 from May’s final reading of 58.4. The index data goes back to 1952, and the June preliminary level represents an all-time low, as the expectations component of the report fell sharply, as did the current conditions component, which was also at a record low. The 1-year inflation expectation inched up to 5.4%—the highest since 1981—from 5.3% in May, where it was expected to remain. The 5-10 year inflation outlook moved higher for the first time in five months, rising to 3.3% from 3.0% in the prior month. Director of the survey Joanne Hsu said that, “While consumer spending has remained robust so far, the broad deterioration of sentiment may lead them to cut back on spending and thereby slow down economic growth.”
- April Consumer Credit showed consumer borrowing expanded by $38.0 billion, above expectations of $35.0 billion. March’s figure was revised downward to an increase of $47.4 billion from the originally reported $52.4 billion. Non-revolving debt, which includes student loans and loans for vehicles and mobile homes, rose $20.3 billion, a +7.1% annual increase, while revolving debt, which includes credit cards, added $17.8 billion, a +19.6% annual rise.
- Weekly MBA Mortgage Application Index fell -6.5% last week to the lowest level in 22 years amid rising rates and slowing home sales. That follows the prior week’s -2.3% drop and marks the fourth consecutive week of declines. The Refinance Index fell -5.6% from last week and is down -75% year-over-year. The Purchase Index dropped -7.1% for the week. The average 30-year mortgage rate rose by +7 basis point (bps) to 5.4% and is up +225 bps from last year.
- Weekly Initial Jobless Claims were 229,000, for the week ended June 4, well above expectations for 206,000 and the prior week’s upwardly revised 202,000. Continuing Claims for the week ended May 28 were flat at 1,306,000, a bit above expectations of 1,303,000.
The Week Ahead
The economic calendar gets busier next week, with the May Producer Price Index (PPI) following last week’s hotter-than-expect CPI consumer inflation data. Additional inflation data comes with the releases of the Import Price Index. After last week’s record low University of Michigan Consumer Sentiment Index results, the NFIB Small Business Optimism Index for May will be released. Housing data is also on tap, with the NAHB Housing Market Index for June and the May Housing Starts and Building Permits, as well as weekly MBA Mortgage Applications. We will also get some the May Leading Economic Index (LEI) from the Conference Board. Of course, a heavy focus will be on the Federal Open Mark Committee’s (FOMC) monetary policy decision, in which the fed funds rate is expected to be raised by 50 bps. Fed Chairman Jerome Powell will hold the post-FOMC decision press conference and the markets will be watching for any hints of whether the rising inflation pressures will make the Fed more hawkish in July and September.
Did You Know?
CASH IS KING – Consumer cash use in the U.S. increased slightly from 2020 to 2021, from 19% to 20% of all consumer payments, according to the Federal Reserve’s recently published annual consumer-payment-choice survey. That was the first uptick since the Fed began the study in 2016, when cash was 31% of consumer payments (source: The Wall Street Journal).
KING DOLLAR – The U.S. dollar is up +7.1% so far this year, according to the widely followed ICE U.S. Dollar Index, or +6.6% as measured by the WSJ Dollar Index, which tracks the dollar against a broader group of currencies (source: The Wall Street Journal).
HOT WATER – Phoenix is offering $2,500 in incentive pay to attract lifeguards – $500 with a first paycheck and $2,000 if the individual works until the end of the 2022 pool season (source: Phoenix Parks and Recreation, BTN Research).
This Week in History
PAY AS YOU GO – On June 9, 1943, federal income tax withholding was implemented for the first time. Originally proposed by Beardsley Ruml, an executive at Macy’s department store who had encouraged shoppers to buy on the installment plan, withholding was called “pay as you go” and was coupled with an amnesty for the previous year’s taxes (source: The Wall Street Journal).
Asset Class Performance
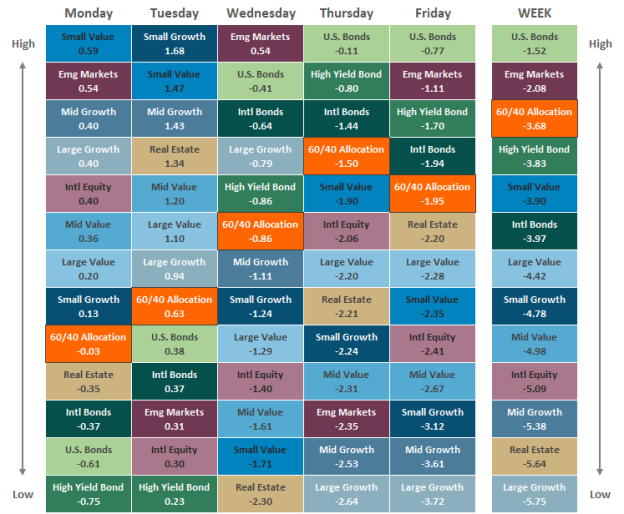
Source: Bloomberg. Asset‐class performance is presented by using market returns from an exchange‐traded fund (ETF) proxy that best represents its respective broad asset class. Returns shown are net of fund fees for and do not necessarily represent the performance of specific mutual funds and/or exchange-traded funds recommended by The Retirement Planning Group. The performance of those funds may be substantially different than the performance of the broad asset classes and to proxy ETFs represented here. U.S. Bonds (iShares Core U.S. Aggregate Bond ETF); High‐Yield Bond (iShares iBoxx $ High Yield Corporate Bond ETF); Intl Bonds (SPDR® Bloomberg Barclays International Corporate Bond ETF); Large Growth (iShares Russell 1000 Growth ETF); Large Value (iShares Russell 1000 Value ETF); Mid Growth (iShares Russell Mid-Cap Growth ETF); Mid Value (iShares Russell Mid-Cap Value ETF); Small Growth (iShares Russell 2000 Growth ETF); Small Value (iShares Russell 2000 Value ETF); Intl Equity (iShares MSCI EAFE ETF); Emg Markets (iShares MSCI Emerging Markets ETF); and Real Estate (iShares U.S. Real Estate ETF). The return displayed as “Allocation” is a weighted average of the ETF proxies shown as represented by: 30% U.S. Bonds, 5% International Bonds, 5% High Yield Bonds, 10% Large Growth, 10% Large Value, 4% Mid Growth, 4% Mid Value, 2% Small Growth, 2% Small Value, 18% International Stock, 7% Emerging Markets, 3% Real Estate.
Chris Bouffard is CIO of The Retirement Planning Group (TRPG), a Registered Investment Adviser. He has oversight of investments for the advisory services offered through TRPG.
Disclaimer: Information provided is for educational purposes only and does not constitute investment, legal or tax advice. All examples are hypothetical and for illustrative purposes only. Past performance of any market results is no assurance of future performance. The information contained herein has been obtained from sources deemed reliable but is not guaranteed. Please contact TRPG for more complete information based on your personal circumstances and to obtain personal individual investment advice.


