Quick Takes
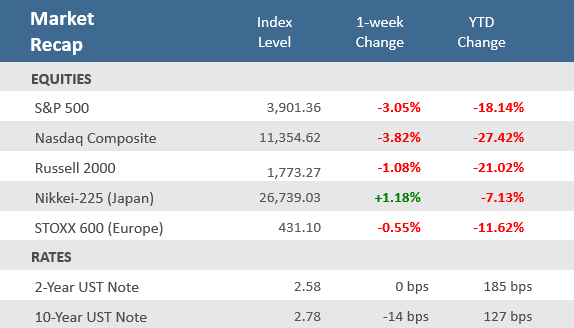
- Stocks couldn’t avoid another week of loses, but the S&P 500 was able to avoid bear market territory. At points in Friday’s trading session the U.S. index was off -20% or worse from its January 4th all-time high, but a furious rally in the last hour left it about -19% from its record high. Still the index marked its seventh straight weekly loss, the longest since 2001.
- The market initially rallied earlier in the week on mostly upbeat economic reports as retail sales, industrial production, capacity utilization, and business inventories all rose. Capacity utilization hit its highest level since 2007 and continuous unemployment claims, a weekly data series, hit its lowest level since December 1969.
- There were other glimmers of hope that the market may be in the process of bottoming, including a decline in bond yields (the 10-year U.S. Treasury fell back to 2.78%), the U.S. dollar retreated from its 20-year high (set last week), commodity prices declined, and there was a partial reopening of the COVID lockdowns in China.
Late-day reversal on Friday helps S&P 500 avert bear market
The markets are still grappling with concerns over the aggressiveness of the Fed’s tightening campaign, persistently elevated inflation pressures, slowing economic growth, and geopolitics. Stocks staged a dramatic reversal in the final hour of trading on Friday and the S&P 500 averted falling into bear market territory, which it traded at earlier in the day. Typically, a bear market is defined as a -20% decline from all-time highs, which was January 4th for the S&P 500. Even without closing in bear territory, the S&P 500 is at its largest decline since the start of the pandemic in March 2020. The market initially rallied earlier in the week on mostly upbeat economic reports as retail sales, industrial production, capacity utilization, and business inventories all rose. Continuous unemployment claims, a weekly data series, hit its lowest level since December 1969. However, but big earnings misses from Walmart and Target disrupted the gains. Surprising weak earnings from those two big retailers torpedoed their stocks, sunk the retail sector, and pulled the entire market lower on Wednesday. The -4.0% loss that day was the worst day for the S&P 500 since a -5.9% loss on June 11, 2020. Even with Friday’s late rally it was down -3.1% for the week. The damage wasn’t limited to the retail sector though, the tech-heavy Nasdaq fell -4.7% on Wednesday and -3.8% for the week. It was the seventh straight weekly loss for the S&P 500 and Nasdaq, their longest weekly losing streaks since 2001 and the dot-com bust. Unlike the S&P 500 the Nasdaq is already in bear market territory, down -29% from its record high on November 19, 2021. The Dow Jones Industrial Average is also clear of bear market territory, down -15% from its record high on January 4th, but it is on an eight week losing streak which is its longest since 1923!
Aside from some decent economic releases, there was some other good news over the week, including a decline in the 10-year U.S. Treasury yield (back to 2.78%), the U.S. dollar retreated from its 20-year high (set last week), commodity prices slipped, and there was a partial reopening of the COVID lockdowns in China. Looking forward, there’s another cadre of retailers — including Costco, Macy’s, Nordstrom and Best Buy – reporting earnings in the coming week and if there’s more weakness from them it could be a negative catalyst for an already wobbly market. Like last week, there are several regional Fed president’s speaking and Fed Chairman Jerome Powell will also be speaking again on Tuesday afternoon. Last week Powell said “We need clear and convincing evidence that inflation is coming down” before the Fed slows its pace of rate increases. He was positive on the U.S. economy saying that “the underlying strength of the U.S. economy is really good right now. The U.S. economy is strong, the labor market is extremely strong. It is still at very healthy levels. Retail sales numbers, the economy is strong. Consumer balance sheets are healthy. Businesses are healthy. The banks are well-capitalized. This is a strong economy.” In fact, with China’s economy, the second largest behind the U.S., suffering from their COVID lockdowns, the U.S. economy may grow faster than China for the first time since 1976, according to Bloomberg.
Chart of the Week
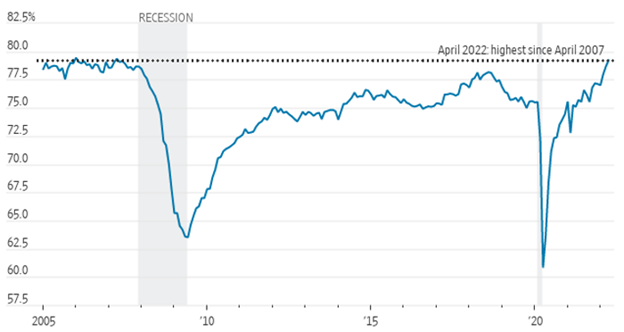
On Tuesday, the Federal Reserve’s report on Industrial Production – a measure of factory, mining, and utility output – showed a +1.1% increase in April, matching expectations, and above March’s unrevised 0.9% increase. The Fed said manufacturing output, mining production, and utilities all rose in the month. Manufacturing, the biggest component of industrial production, got a big lift from the auto sector, which saw output rise for the second consecutive month. In a sign that factories were racing to meet demand, Capacity Utilization was at the highest level in 15 years, inching up to 79.0% from the prior month’s downwardly revised 78.2% and beating expectations for an increase to 78.6%.
U.S. Manufacturing Capacity Utilization
Source: Federal Reserve via the St. Louis Fed, The Wall Street Journal.
Economic Review
- The Conference Board’s Leading Economic Index (LEI) for April declined -0.3% in the month, below expectations to remain unchanged, and down from March’s downwardly revised +0.1% increase. The index recorded its second negative monthly reading of the year as half of the 10 components declined led by consumer expectations, while building permits, jobless claims, average workweek, and ISM new orders also moved lower. Positive contributions came from the interest rate spread and credit conditions. Year-over-year the LEI is up +4.7%, down from +6.1% in March.
- The May Philly Fed Manufacturing Business Outlook Index fell much more than expected but remained in expansion territory (a reading above zero), dropping to 2.6 versus estimates of a decline to 15.0 from 17.6 in April. Growth in new orders and shipments both accelerated, but employment growth decelerated, and inventory expansion slowed soundly. Prices paid cooled somewhat but remain very elevated.
- April Housing Starts dipped -0.2% in the month to an annual rate of 1,724,000 units, missing expectations for a 1,756,000 unit pace, and down from March’s downwardly revised pace of 1,728,000 units. Building Permits, one of the leading indicators tracked by the Conference Board as it is a gauge of future construction, fell by -3.2% in the month to an annual rate of 1,819,000, slightly above expectations of 1,814,000 units, but down from the downwardly revised 1,870,000 unit pace in March.
- April Existing Home Sales fell -2.4% in the month to an annual rate of 5.61 million units, just shy of expectations of 5.64 million, and below March’s downwardly revised 5.75 million units. Contract closings fell for the third-straight month as sales in two of the four major U.S. regions declined month-over-month, while sales in the other two regions rose. Compared to last year, sales were lower in all regions. The median existing home price was up +14.8% from a year ago to a record high $391,200 and are up for 122 straight months as prices grew in each region. Unsold inventory was at a 2.2-months pace at the current sales rate, up from the from the 1.9-months pace a year earlier. Existing home sales account for a large majority of the home sales market and reflect contract closings instead of signings.
- In other housing news, the weekly MBA Mortgage Application Index fell -11.0% last week, following the prior week’s increase of +2.0%, and breaking the two-week winning streak. The Refinance Index fell -9.5% and the Purchase Index tumbles -11.9%. The average 30-year mortgage rate declined by -4 basis point (bps) to 5.49%, but remains up +234 bps from last year.
- Weekly Initial Jobless Claims were 218,000, for the week ended May 14, above expectations for 200,000 and the prior week’s downwardly revised 197,000. Continuing Claims for the week ended May 7 dropped by 25,000 to 1,317,000, below expectations of 1,323,000. That represents the lowest level since December 1969.
The Week Ahead
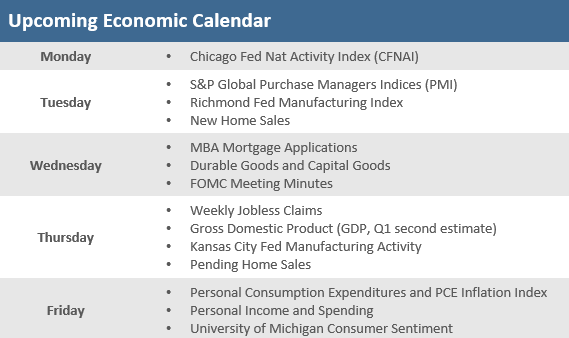
In the coming week, the economic calendar includes Wednesday’s release of the Federal Reserve’s minutes from its last FOMC meeting, Thursday brings the second look at Q1-2022 Gross Domestic Product (GDP), as well as Personal Consumption expenditures (PCE) on Friday. The PCE data also includes the PCE Inflation Index, watched closely by the Fed. On the earnings front, there are a bunch of retailers reporting — including Costco, Macy’s, Nordstrom and Best Buy — which will be watched closely after last week’s big earnings misses from Target and Walmart. Other retailers reporting earnings in the coming week include Ulta Beauty, Macy’s, Dick’s Sporting Goods, and discounters Dollar Tree and Dollar General. Regional Fed presidents aren’t quite as busy as the prior week, but still have a few appearances. Atlanta Fed President Raphael Bostic and Kansas City Fed President Esther George speak on Monday, and San Francisco Fed President Mary Daly speaks Thursday afternoon. Fed Chairman Jerome Powell will also be speaking at the National Center for American Indian Enterprise Development summit on Tuesday afternoon and Fed Vice Chair Lael Brainard speaks Wednesday afternoon.
Did You Know?
HOW MUCH? – Fed Chairman Jerome Powell foreshadowed on 5/04/2022 the prospect of rate increases at each of the remaining 5 Fed meetings in 2022, including 0.50 percentage point increases at the next 2 meetings (scheduled for June and July). Powell’s comments equate to 2.5 percentage point increases in 2022, matching the 2.5 percentage point rate hikes implemented by the Fed in 1994 or 28 years ago (source: Federal Reserve, BTN Research).
RECORD HIGH – Tax receipts collected by the U.S. in April 2022 were $863.6 billion, creating a monthly surplus of $308.2 billion, both numbers representing all-time monthly records for the U.S. (source: Treasury Department, BTN Research).
SIX STEPS FORWARD ONE STEP BACK – From 12/31/2019 to 12/31/2021, the value of all U.S. individual stocks increased by $19.5 trillion (+57%) to $53.4 trillion, before falling $5.1 trillion (10%) in the 1Q 2022 to $48.3 trillion (source: Siblis Research, BTN Research).
This Week in History
HISTORICAL HIKES – On this day in 1994, the Federal Reserve raised interest rates by half a percentage point. Believing that this hike—the fourth in three months—was the last, analysts turned bullish on bonds, and the price on 5-year Treasury notes shot up by 0.22%, one of the biggest jumps in years. The Fed went on to raise rates by another 1.25 percentage points by year-end, and bonds had their worst year since 1967 (source: The Wall Street Journal).
Asset Class Performance
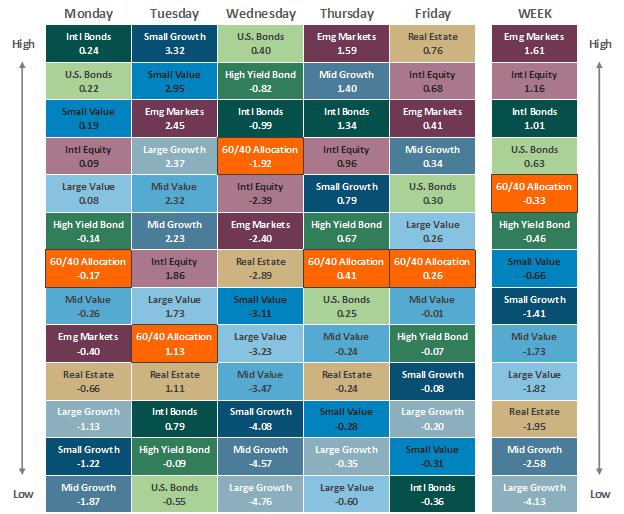
Source: Bloomberg. Asset‐class performance is presented by using market returns from an exchange‐traded fund (ETF) proxy that best represents its respective broad asset class. Returns shown are net of fund fees for and do not necessarily represent the performance of specific mutual funds and/or exchange-traded funds recommended by The Retirement Planning Group. The performance of those funds may be substantially different than the performance of the broad asset classes and to proxy ETFs represented here. U.S. Bonds (iShares Core U.S. Aggregate Bond ETF); High‐Yield Bond (iShares iBoxx $ High Yield Corporate Bond ETF); Intl Bonds (SPDR® Bloomberg Barclays International Corporate Bond ETF); Large Growth (iShares Russell 1000 Growth ETF); Large Value (iShares Russell 1000 Value ETF); Mid Growth (iShares Russell Mid-Cap Growth ETF); Mid Value (iShares Russell Mid-Cap Value ETF); Small Growth (iShares Russell 2000 Growth ETF); Small Value (iShares Russell 2000 Value ETF); Intl Equity (iShares MSCI EAFE ETF); Emg Markets (iShares MSCI Emerging Markets ETF); and Real Estate (iShares U.S. Real Estate ETF). The return displayed as “Allocation” is a weighted average of the ETF proxies shown as represented by: 30% U.S. Bonds, 5% International Bonds, 5% High Yield Bonds, 10% Large Growth, 10% Large Value, 4% Mid Growth, 4% Mid Value, 2% Small Growth, 2% Small Value, 18% International Stock, 7% Emerging Markets, 3% Real Estate.
Chris Bouffard is CIO of The Retirement Planning Group (TRPG), a Registered Investment Adviser. He has oversight of investments for the advisory services offered through TRPG.
Disclaimer: Information provided is for educational purposes only and does not constitute investment, legal or tax advice. All examples are hypothetical and for illustrative purposes only. Past performance of any market results is no assurance of future performance. The information contained herein has been obtained from sources deemed reliable but is not guaranteed. Please contact TRPG for more complete information based on your personal circumstances and to obtain personal individual investment advice.


