Quick Takes
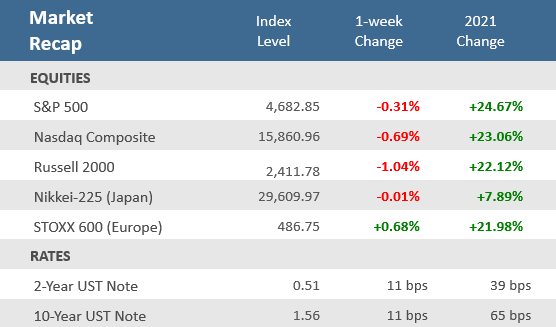
- Several win streaks for stocks came to an end in the week ending November 12. The S&P 500 had a five-week win streak that snapped after slipping -0.3%. The S&P 500’s eight-session winning streak and the Nasdaq Composite’s 11-session winning streak also came to an end during the week. Small-cap stocks were the laggards, with the Russell 2000 Index falling -1.0%.
- The yield on the U.S. 10-year Treasury reversed higher after falling for two straight weeks, rising by 11 basis points. Likewise, the yield on the U.S. 2-year Treasury note also rose 11 basis points – its biggest weekly increase since the same week in November 2019. As a result, the Bloomberg U.S. Aggregate Bond Index fell -0.75% for the week.
- Multiple inflation gauges showed pricing pressures running hot across large swathes of the U.S. economy. The Producer Price Index had an annual increase that was the most since 2010, the annual increase in the Consumer Price Index was the highest since 1990, and the NFIB Small Business survey showed 53% respondents raised prices – the most on record.
Inflation Continues to Run Hot, Cooling Off Stocks
Stronger-than-expected inflation signals from the Producer Price Index, Consumer Price Index, and the NFIB Small Business Optimism survey led to a sharp rise in Treasury yields over the week, especially for short-term maturities. The yield on the 2-year U.S. Treasury Note rose +11 basis points, its most significant weekly jump in two years, matching the increase in the 10-year Treasury yield. Accordingly, the CME Group’s CME Fed Watch Tool showed the probability for a rate hike in June 2022 increase to 69.1% from 50.9% the prior week. That sent equity investors into profit-taking mode after healthy gains over the last several weeks. Most major equity indices fell for the week, snapping multi-week streaks of gains. Still, the S&P 500 remains up about 25% for the year.
It wasn’t just stock returns that were impacted by the inflation readings. The odds of quick approval of President Biden’s Administration’s Build Back Better bill also diminished after Senator Joe Manchin (D-WV) voiced concern that the legislation would fuel further inflation pressures on top of last week’s passage of a $1.1 trillion infrastructure package and the $1.9 trillion COVID-19 relief bill passed in March. The congressional agenda is already heavy between November and December, as Congress will need to raise the debt ceiling, fund the government, and pass a defense spending bill. With those priorities, the holidays, and now the focus on inflation, the entire Build Back Better package faces increasing chances of being stalled or scaled-back.
Chart of the Week
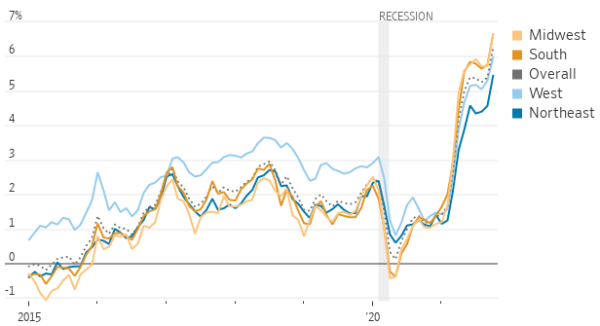
In October, U.S. inflation rose at the fastest pace in three decades, with prices increasing more in some parts of the country than in others. Consumer prices were up +7.3% last month in the region encompassing Iowa, Kansas, Minnesota, Missouri, Nebraska, North Dakota, and South Dakota. Midwesterners saw relatively higher housing costs in October, with rent, natural gas, and home furnishings all rising at a brisker clip than other regions. Rental prices in Northeastern states, by contrast, grew at a much slower pace than elsewhere last month.
Inflation has risen the most in the Midwest and South
Change in consumer prices from a year earlier, by region
Source: Labor Department via St Louis Fed, The Wall Street Journal. Note: For all urban consumers.
Economic Review
- The NFIB Small Business Optimism Index fell to its lowest level since March, as it slipped to 98.2 in October from 99.1 in September and below expectations for an increase to 99.5. A record-high share of business owners said they raised compensation, and an unprecedented number are planning to in coming months as they seek to fill vacancies. A net 53% of owners reported raising prices, a record high for data going back to 1986. More than half of respondents plan to increase costs in the next three months, also a record high.
- The Producer Price Index (PPI) rose +0.6% in October from September’s 0.5% increase and aligned with economists’ expectations. On an annual basis, PPI was +8.6% higher, in line with expectations and September’s gain. Core PPI, which strips out the more volatile food and energy items, was up +0.4% from +0.2% in September and below estimates for a +0.5% gain. The Core PPI annual rate was +6.8%, also in line with estimates and August’s +6.8% increase.
- The Consumer Price Index (CPI) rose +0.9% in October, above the estimate of +0.6%. On a year-over-year basis, CPI was +6.2% higher, also above the forecast for +5.9% and the quickest acceleration in 30 years. The Bureau of Labor Statistics (BLS) said that the monthly increase was broad-based, and the components for energy, shelter, food, used cars and trucks, and new vehicles were significant contributors. Energy was up +30.0% in the last 12 months, and food increased +5.3%. Core CPI, which strips out the more volatile food and energy items, rose +0.6% versus an unadjusted +0.2% in September and above the +0.4% expected. Year-over-year, core prices were up +4.6%, above +4.0% in September, and the forecast of +4.3%.
- The November initial release of the University of Michigan Consumer Sentiment Index fell to 66.8 from 71.7 in October and well under expectations for a rise to 72.5. The index hit a ten-year low as both the current conditions and the expectations components deteriorated. The 1-year inflation forecast rose to 4.9% from October’s 4.8% rate, matching forecasts. The University of Michigan said, “Consumer sentiment fell in early November to its lowest level in a decade due to an escalating inflation rate and the growing belief among consumers that no effective policies have yet been developed to reduce the damage from surging inflation.”
- U.S. job openings fell in September but remained well above pre-pandemic levels as employers continue to struggle to find workers. The Job Openings and Labor Turnover Survey, or JOLTS report, showed a drop in openings to 10.4 million, down from an upwardly revised 10.6 million in August. Economists expected 10.3 million job openings. The quit rate rose to 3.0% from 2.9% in August, as quits increased by 164,000 to a record-high 4.4 million.
- Weekly unemployment claims fell to 267,000, another post-pandemic low, but underestimates of 260,000 and last week’s upwardly revised 271,000 level. Continuing claims fell by 59,000 to 2,160,000, above estimates of 2,050,000.
The Week Ahead
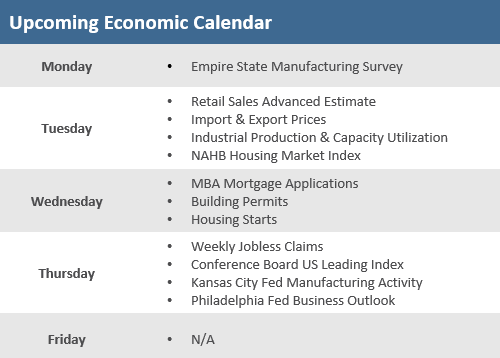
More robust economic data next week may push the Federal Reserve towards further policy tightening steps. The October Retail Sales and Industrial Production reports on Tuesday are next week’s highlights and both should be strong. Solid manufacturing growth is expected in the Industrial Production release given the strong PMI reports already released. The strong inflation results seen in the CPI, PPI, and NFIB Small Business reports last week may push the Fed to consider swifter action on rate normalization. Housing data will also be in focus with the releases of the NAHB Housing Market Index, housing starts, and building permits.
Did You Know?
PAYING A LOT MORE — The average price of a gallon of gasoline has gone up by more than $1 during the calendar year 2021, rising from $2.253 a gallon as of 12/31/2020 to $3.421 a gallon as of Friday 11/05/2021. The last calendar year that experienced gas prices rising by at least $1 a gallon was 2009 (Source: AAA, BTN Research).
UP AND DOWN — The nation’s personal savings rate, which soared during the early months of the pandemic, has now fallen back to its pre-pandemic levels. The savings rate was 7.5% in November 2019, rose to 8% in April 2020, and now has come back to 7.5% in September 2021 (Source: Bureau of Economic Analysis, BTN Research).
MIDTERMS — The midterm elections will be held in one year on 11/08/2022. All 435 House seats and 34 of 100 Senate seats will be contested. The President’s party has lost House seats in 18 of the last 20 midterms, while the President’s party has lost Senate seats in 14 of the last 20 midterms (Source: American Presidency Project, BTN Research).
This Week in History
Corporate balance sheets and income statements can trace their heritage to this week in the year 1494 when the first edition of Luca Pacioli’s “Summa de Arithmetica, Geometria, Proportioni et Proportionalita” was printed in Venice, containing 36 chapters on accounting. This popularized double-entry bookkeeping, which offsets assets against liabilities and revenues against expenses (Source: The Wall Street Journal).
Asset Class Performance
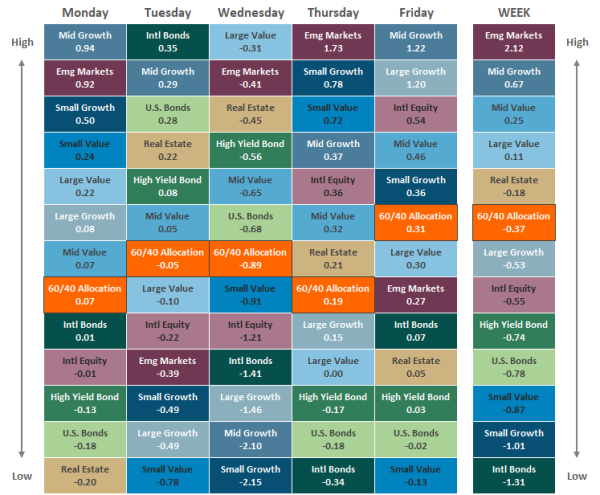
The Importance of Diversification. Diversification mitigates the risk of relying on any single investment and offers a host of long-term benefits, such as lowering portfolio volatility, improving risk-adjusted returns, and helping investments to compound more effectively.
Source: Bloomberg. Asset‐class performance is presented by using market returns from an exchange‐traded fund (ETF) proxy that best represents its respective broad asset class. Returns shown are net of fund fees for and do not necessarily represent the performance of specific mutual funds and/or exchange-traded funds recommended by The Retirement Planning Group. The performance of those funds may be substantially different than the performance of the broad asset classes and to proxy ETFs represented here. U.S. Bonds (iShares Core U.S. Aggregate Bond ETF); High‐Yield Bond (iShares iBoxx $ High Yield Corporate Bond ETF); Intl Bonds (SPDR® Bloomberg Barclays International Corporate Bond ETF); Large Growth (iShares Russell 1000 Growth ETF); Large Value (iShares Russell 1000 Value ETF); Mid Growth (iShares Russell Mid-Cap Growth ETF); Mid Value (iShares Russell Mid-Cap Value ETF); Small Growth (iShares Russell 2000 Growth ETF); Small Value (iShares Russell 2000 Value ETF); Intl Equity (iShares MSCI EAFE ETF); Emg Markets (iShares MSCI Emerging Markets ETF); and Real Estate (iShares U.S. Real Estate ETF). The return displayed as “Allocation” is a weighted average of the ETF proxies shown as represented by: 30% U.S. Bonds, 5% International Bonds, 5% High Yield Bonds, 10% Large Growth, 10% Large Value, 4% Mid Growth, 4% Mid Value, 2% Small Growth, 2% Small Value, 18% International Stock, 7% Emerging Markets, 3% Real Estate.
Chris Bouffard is CIO of The Retirement Planning Group (TRPG), a Registered Investment Adviser. He has oversight of investments for the advisory services offered through TRPG.
Disclaimer: Information provided is for educational purposes only and does not constitute investment, legal or tax advice. All examples are hypothetical and for illustrative purposes only. Past performance of any market results is no assurance of future performance. The information contained herein has been obtained from sources deemed reliable but is not guaranteed. Please contact TRPG for more complete information based on your personal circumstances and to obtain personal individual investment advice.


