Quick Takes
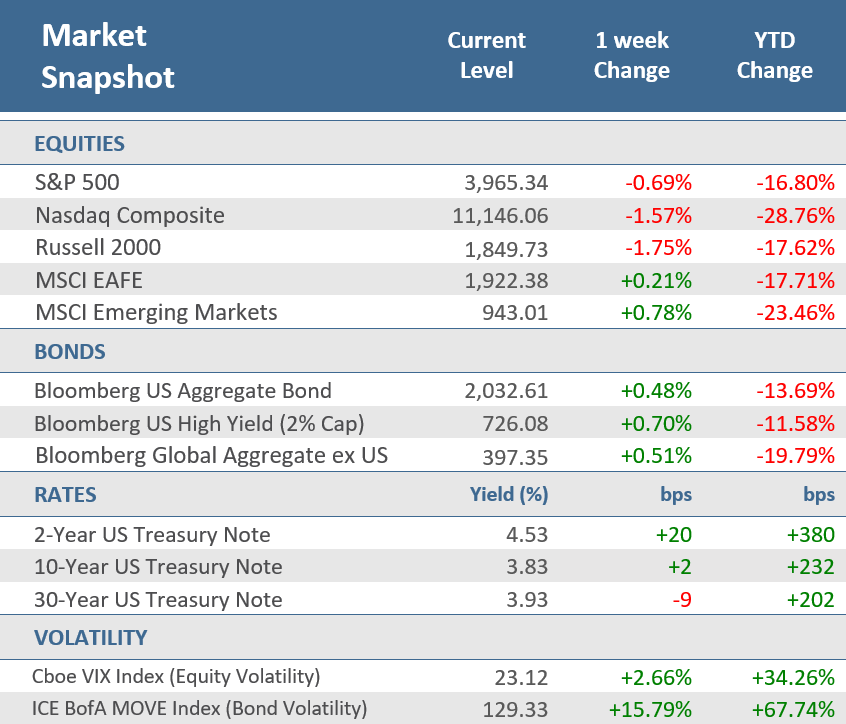
- The main U.S. indexes ended the week with losses as doubts rose about the recent rally being sustained, despite signs of easing inflation. The S&P 500 fell -0.7%, the tech-heavy Nasdaq Composite slid -1.6%, and the small cap Russell 2000 dropped -1.8%.
- The yield on the 2-year Treasury is now 70 basis points higher than the yield on the 10-year Treasury, representing the deepest inversion of the yield curve since the double-dip recession of the early 1980s. Still, the Bloomberg U.S. Aggregate Bond Index was up +0.5%.
- The Producer Price Index (PPI), like the Consumer Price Index (CPI) the prior week, came in lower-than-expected. The combination of CPI and PPI falling for successive months may signal that inflation in the U.S. might have peaked.
Stocks pause even as inflation cools further
The main U.S. indexes ended the week with losses as doubts rose about the recent rally being sustained, despite signs of easing inflation. The October inflation picture came more into during the week, with a slower-than-expected Producer Price Index (PPI) and a small decline in the Import Price Index, which follows the prior week’s weaker-than-expected Consumer Price Index (CPI). That gave some hope that the Fed may not have to be as aggressive with rate hikes going forward. However, the week’s hawkish commentary from Fed officials threw some cold water on that notion. Stocks edged to the downside towards the end of the week after St. Louis Federal Reserve President James Bullard said the central bank’s appropriate target for the federal funds rate could end up as high as 7%, well above the current 3.75%-4% range. The Boston Fed’s Susan Collins followed on Friday, saying that she was not ruling out a 75-basis point rate hike in December, versus consensus estimates for a 50-basis point hike. For the week, the S&P 500 fell -0.7%, the tech-heavy Nasdaq Composite slid -1.6%, and the small cap Russell 2000 dropped -1.8%. All three indexes are positive for the month, however.
The yield on the US 10-year Treasury note rose by 2 basis points to 3.83%, but the 2-year Treasury yield was up 20 basis points to 4.53%. That put the 2-year to 10-year yield curve at a -70 basis points, the deepest inversion since the double-dip recession of the early 1980s. Despite the increase in Treasury yields, the Bloomberg U.S. Aggregate Bond Index gained +0.5% for the week, to lead most major asset classes.
Oil has fallen back below $80 a barrel as U.S. West Texas Intermediate (WTI) finished the week -9.98% lower, capping its worst weekly stretch since April, when it lost -12.7%, and is down for a second straight week. The market was pressured by concern about weakening demand in China and further increases in interest rates.
Chart of the Week
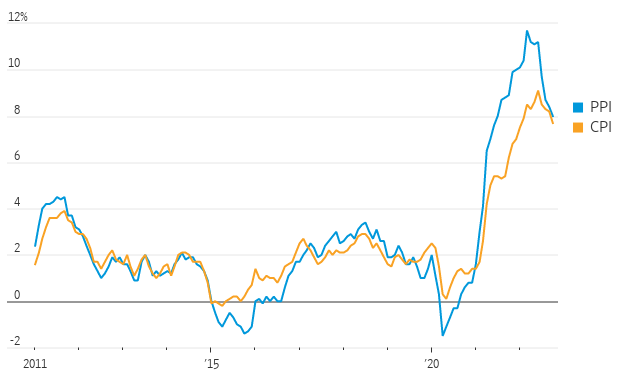
The pace of wholesale price increases slowed in October for the second straight month, another indication that overall inflation pressures may be easing. The Producer-Price Index (PPI), which generally reflects supply conditions in the economy, climbed +8% year-over-year from last October. That remains historically high, but it marked a moderation from September’s revised +8.4% increase, and was down sharply from +11.7% in March, the highest level since data began in 2010. Month-over-month PPI was up +0.2%, slower than expectations for a +0.4% gain, and in line with September’s downwardly revised +0.2%. Core PPI, which excludes food and energy, was up +6.7% from last year, below expectations for +7.2%, and September’s downwardly revised +7.1%. Month-over-month, Core PPI was also slower than expectations of +0.3%, and the prior month’s downwardly revised +0.2%. The PPI results join the Consumer Price Index (CPI) from the prior week that also eased in October. Another inflation measure released during the week was the Import Price Index, which fell by -0.2% in October, higher than expectations of -0.4% and higher than the prior month’s upwardly revised -1.1%. But year-over-year, prices were up +4.2%, lower than September’s unrevised +6.0% rise. The combination of CPI and PPI both falling for successive months now, as well as import prices down for the year, may be signaling that inflation in the U.S. might have peaked.
Producer Prices Ease
Producer-Price Index (PPI) and Consumer-Price Index (CPI), 12-month change
Source: Labor Department, The Wall Street Journal.
Economic Review
- The Conference Board’s Leading Economic Index (LEI) fell -0.8% for the month of October, its eighth consecutive monthly loss, and twice as bad as expectations of a -0.4% decline, and below September’s downwardly revised -0.5% drop.
- U.S. Consumer Credit rose +8.3% year-over-year in the third quarter to $16.5 trillion. That’s the biggest jump since the first quarter of 2008. While most of the increase was mortgage debt, credit card balances rose +15% from a year earlier, the largest rise in 20 years. Delinquency rates remain low, however.
- October Existing Home Sales were down -5.9% for the month to an annual rate of 4.43 million units, slightly better than expectations of 4.38 million units, and below September’s downwardly revised 4.69 million units. Contract closings fell for the ninth-straight month and remain at the lowest level since May 2020, down -28.4% from last year. Month-over-month, sales across the four major regions were all lower. The Median Existing Home Price was up +6.6% from a year ago to $379,100, the 128th straight year-over-year increase, but it was the fourth month in a row that the median sales price decelerated from the record high of $413,800 in June. The number of homes for sale increased for the third month in a row, with the unsold inventory at a 3.2 month’s supply at the current sales pace, up from 2.4 months in the same period last year.
- October Housing Starts fell -4.2% for the month to an annual pace of 1,425,000 units, better than expectations for a decline of -0.6% drop to a 1,418,000-unit pace, but below September’s downwardly revised 1,488,000 unit level. Building Permits, one of the leading indicators tracked by the Conference Board as it is a gauge of future construction, declined by -2.4% for the month to an annual rate of 1,526,000, above expectations of -0.8% to 1,512,000 units, and below the upwardly revised 1,564,000-unit pace posted in September.
- Advance Retail Sales for October were up +1.3% for the month, better than expectations of +1.0% and September’s unrevised flat reading. Sales ex-autos rose +1.3%, higher than expectations of +0.4% and September’s unrevised +0.1%. Sales ex-autos and gas were up +0.9%, also higher than expectations, which were +0.2%, and higher than September’s upwardly revised +0.6%. The control group, a figure used to calculate GDP, came in +0.7% higher, better than the expectation of +0.3%, and the prior month’s upwardly revised +0.6%.
- October Industrial Production fell -0.1%, below expectations for a +0.2% increase, and down from September’s downwardly revised +0.1%. Capacity Utilization was also below expectations, falling to 79.9%, versus estimates for a rise to 80.4% from the prior month’s downwardly revised 80.1%.
- The November National Association of Home Builders (NAHB) Housing Market Index (HMI) showed homebuilder sentiment fell more than expected, dropping to 33 from October’s unrevised 38, and below expectations for a decline to 36. This was the fourth-straight month that homebuilder sentiment was below 50—which suggests poor conditions—and has fallen for eleven-straight months.
- Business Inventories rose +0.4% in September, slightly below expectation for a +0.5% increase, and below August’s downwardly revised +0.9% advance.
- The Empire Manufacturing Index, a measure of activity in the New York region, unexpectedly moved into expansion territory (a reading above zero) for November. The index climbed to 4.5 from -9.1 in October, well above expectations of -5.0.
- The Philly Fed Manufacturing Business Outlook Index unexpectedly fell further into contraction territory (a reading below zero) for November, tumbling to -19.4 from October’s -8.7, and versus estimates for an improvement to a reading of -8.0.
- Kansas City Fed Manufacturing Activity increased in November to -6, beating expectations for -8 and above -7 the prior month. New Orders rose to -12 from -16 last month.
- The weekly MBA Mortgage Application Index rose +2.7% from the prior week’s -0.1% decline. It was the first increase in eight weeks as the Refinance Index was down -1.6% from last week and the Purchase Index was up +4.4% for the week. The decrease came as the average 30-year mortgage rate fell 24 bps to 6.90%, which is up 3.74 percentage points versus a year ago.
- Weekly Initial Jobless Claims fell by 4,000 to 222,000 for the week ended November 12, below expectations for 223,000, and the prior week’s upwardly revised 226,000. Continuing Claims for the week ended November 5 rose by 13,000 to 1,507,000, higher than expectations of 1,500,000.
The Week Ahead
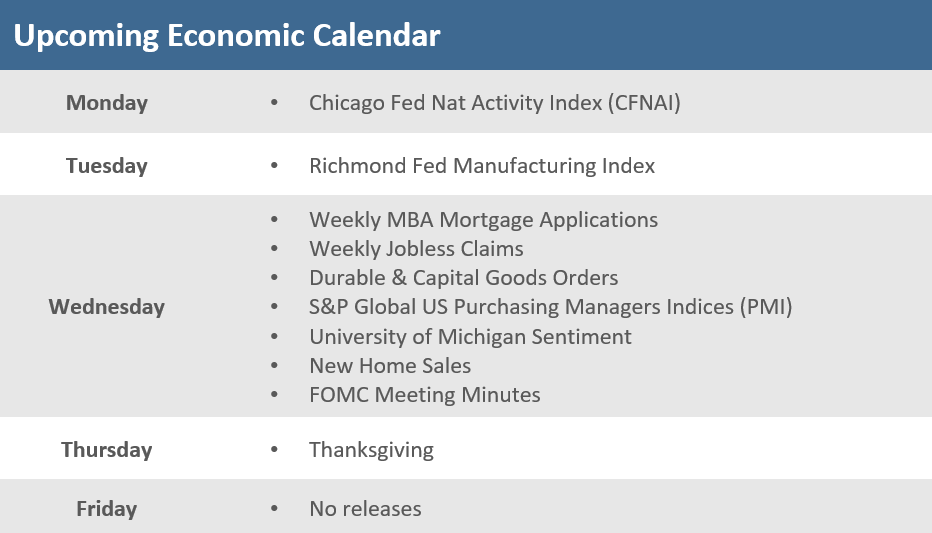
The economic calendar is light, with virtually all the action on Wednesday, given the Thanksgiving holiday-shortened schedule. That could mean lighter than average trading volume for stocks. The primary focus of the week may be the release of the minutes of the last FOMC meeting. While that meeting took place before the October CPI report, the market could see a jolt if a hawkish tone by Fed officials is seen. New orders for durable goods (October), new-home sales (October), and consumer sentiment (November) will also be delivered. Just a few earnings reports are left for the third quarter earnings season with Best Buy, Dollar Tree, and DICK’s Sporting Goods among those with releases. Happy Thanksgiving!
Did You Know?
SWIFT REACTION – Taylor Swift’s first tour in five years broke sales records and overwhelmed Ticketmaster. Ms. Swift’s presale for her 52-date stadium run sold over two million tickets—more than any other artist in a single day. The presale was part of an effort to ensure that actual fans, rather than scalpers, got the first crack at tickets for her “Eras Tour.” The general-public sale was canceled after the presale left few available seats (source: The Wall Street Journal).
EIGHT IS ENOUGH – The population of the planet hit 8 billion last week, according to projections from the United Nations. The number is expected to grow to 8.5 billion by 2030 as life expectancy rises. U.N. officials credited the growth to humanity’s achievements in medicine, nutrition, public health, and personal hygiene. The milestone came about a year later than expected because the Covid-19 pandemic slowed global birthrates and killed millions of people (source: The Wall Street Journal).
DOG DEFLATION – The price of a hot dog combo at Sam’s Club, a warehouse chain owned by Walmart, was marked down to $1.38 from $1.50. The price undercuts rival warehouse club Costco, which has offered a $1.50 hot dog and soda combo at its stores since 1985. The hot dog price cut also marks the first time that Sam’s Club has lowered the charge for the combo, which had remained unchanged for more than 20 years (source: The Wall Street Journal).
This Week in History
TICKER TIME – On November 15, 1867, the first practical stock ticker went “online,” as Thomas Edison’s improved gizmo made continuous nationwide transmission of stock prices possible for the first time (source: The Wall Street Journal).
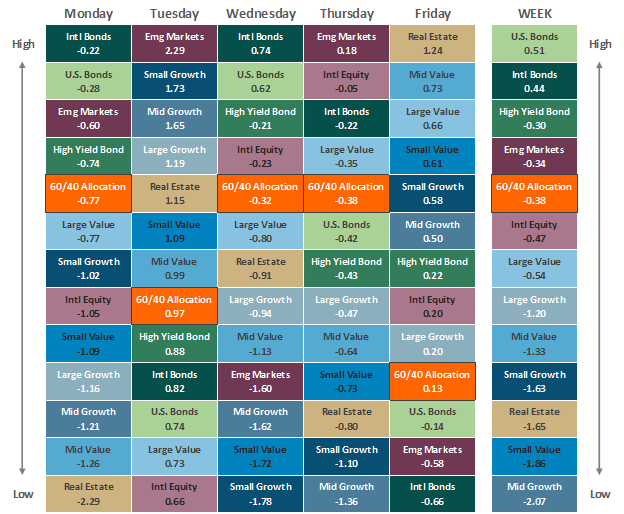
Asset Class Performance
The Importance of Diversification. Diversification mitigates the risk of relying on any single investment and offers a host of long-term benefits, such as lowering portfolio volatility, improving risk-adjusted returns, and helping investments to compound more effectively.
Source: Bloomberg.
Asset‐class performance is presented by using market returns from an exchange‐traded fund (ETF) proxy that best represents its respective broad asset class. Returns shown are net of fund fees for and do not necessarily represent performance of specific mutual funds and/or exchange-traded funds recommended by The Retirement Planning Group. The performance of those funds may be substantially different than the performance of the broad asset classes and to proxy ETFs represented here. U.S. Bonds (iShares Core U.S. Aggregate Bond ETF); High‐Yield Bond (iShares iBoxx $ High Yield Corporate Bond ETF); Intl Bonds (SPDR® Bloomberg Barclays International Corporate Bond ETF); Large Growth (iShares Russell 1000 Growth ETF); Large Value (iShares Russell 1000 Value ETF); Mid Growth (iShares Russell Mid-Cap Growth ETF); Mid Value (iShares Russell Mid-Cap Value ETF); Small Growth (iShares Russell 2000 Growth ETF); Small Value (iShares Russell 2000 Value ETF); Intl Equity (iShares MSCI EAFE ETF); Emg Markets (iShares MSCI Emerging Markets ETF); and Real Estate (iShares U.S. Real Estate ETF). The return displayed as “Allocation” is a weighted average of the ETF proxies shown as represented by: 30% U.S. Bonds, 5% International Bonds, 5% High Yield Bonds, 10% Large Growth, 10% Large Value, 4% Mid Growth, 4% Mid Value, 2% Small Growth, 2% Small Value, 18% International Stock, 7% Emerging Markets, 3% Real Estate.
* The term basis points (bps) refers to a common unit of measure for interest rates and other percentages in finance. One basis point is equal to 0.01%. Bond prices and bond yields are inversely related. As the price of a bond goes up, the yield decreases.


