Quick Takes
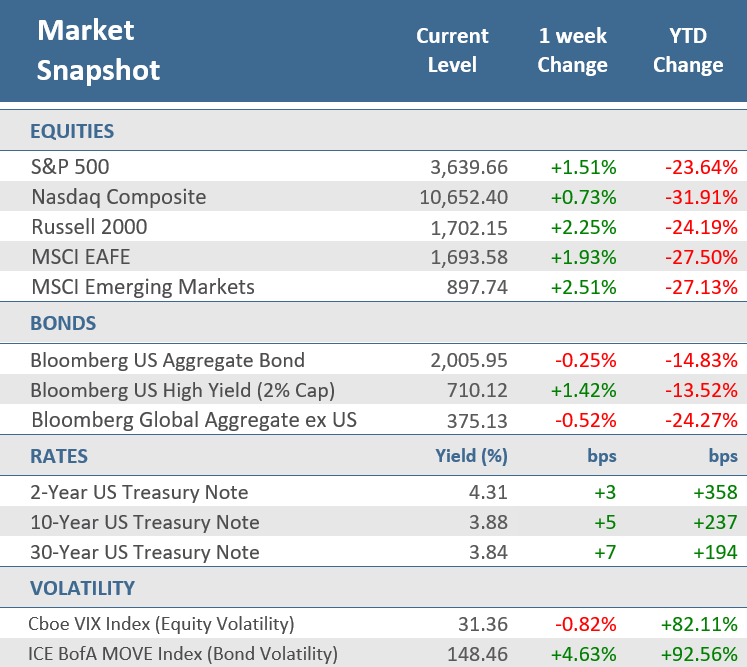
- The first week of the fourth quarter started with a furious two-day rally, that saw the S&P 500 jump nearly +6%, but much of those gains evaporated as Fed made it clear that they would not be retreating from their aggressive path of interest rate hikes.
- Bonds struggled with the realization that there would be no Fed pivot. The 10-year US Treasury yield rose to 3.88%, while the 2-year US Treasury yield was up to 4.31%. The Bloomberg Aggregate Bond Index finished the week down -0.3%.
- September nonfarm payrolls rose by 263,000 jobs, comfortably beating expectations for 255,000 new jobs, and the unemployment rate unexpectedly fell to 3.5%, matching the multi-decade low it touched in July.
Markets tried and failed once again to catch a Fed pivot.
Investors tried and failed once again this week to catch a Fed pivot to a less aggressive monetary policy. Stocks soared on Monday and Tuesday, with the S&P 500 logging its best two-day stretch since 2020 as lower-than-expected manufacturing sector activity and job openings led investors to hope that the Fed might slow its pace of interest-rate increases in the coming months. However, the central bank simply refuses to believe inflation has sufficiently slowed for them to back off their pace of interest rate increases, which is the fastest rate hiking cycle since the early 1980s. The rally failed to last with the major indexes stumbling over the next two days, and then tumbling further on Friday after the Labor Department’s September employment report showed the labor market remained strong, as employers added more jobs than expected and the unemployment rate unexpectedly fell lower to 3.5%. Friday’s jobs report was the last one that will be released before the Fed’s rate-setting committee meets in early November. As a result, absent materially lower inflation data this week, the Fed is likely to raise the fed funds rate by another 75 basis points (0.75 percentage points) at the November meeting.
After being up +5 to +6% from the sharp two-day rally that kicked off this week, the major averages gave back much of the gains but still managed to end the week higher. The S&P 500 rose +1.5%, the Nasdaq Composite gained +0.7%, and the small-cap Russell 2000 Index fared the best with a +2.3% gain. Developed non-U.S. stocks did better with the MSCI EAFE Index up +1.9% and the MSCI Emerging Markets had its best week since July with a +2.5% gain.
Bonds are struggling with tighter financial conditions, as U.S. Treasury yields continue to rise. Treasury yields advanced following the jobs report, with the yield on the 2-year note closing 3 basis points (bps) higher on the week at 4.32%, the yield on the 10-year note was up 5 bps to 3.88%, and the 30-year bond was up 7 bps to 3.84%. As a result, the Bloomberg U.S. Aggregate Bond Index slipped -0.3% and non-U.S. bonds fell -0.5% (using the Bloomberg Global Aggregate ex U.S. Index).
The price of a barrel of West Texas Intermediate crude oil rose $10 to $90.15 after OPEC+ announced a production cut on Wednesday. OPEC+, a coalition of oil-producing nations, agreed to cut its collective target output by two million barrels per day, which marks the biggest reduction since April 2020, following a recent drop in global oil prices. The move drew an immediate rebuke from the White House, which called the decision shortsighted and suggested the 23-member group was actively supporting Russian President Vladimir Putin.
Chart of the Week
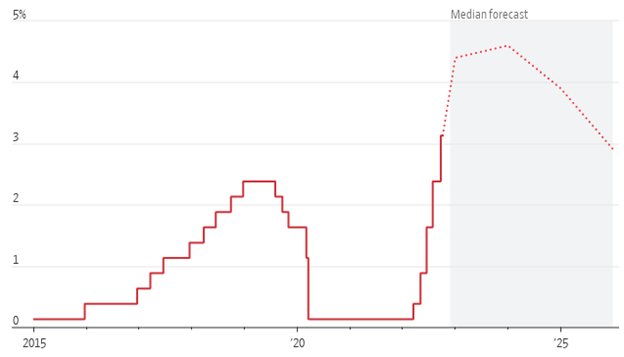
On Thursday Federal Reserve officials claimed stubborn inflation justified continued interest-rate increases. Fed governor Lisa Cook said the central bank will need to keep rates at restrictive levels “until we are confident that inflation is firmly on the path toward our 2% goal.” Fed governor Christopher Waller, speaking separately, said he still expects Fed officials to raise rates into early next year, even though they were starting to see signs of progress in their efforts to slow the economy and bring down inflation.
Hike and Hold
Federal-funds rate target
Source: Federal Reserve, The Wall Street Journal.
Economic Review
- The September Institute for Supply Management (ISM) Manufacturing Purchasing Managers Index indicated continued manufacturing expansion (a reading above 50), but at a slower pace than expected at the lowest level since May 2020, continuing a downward trend in factory activity. The index fell to 50.9, versus the expectations for a decrease to 52.0 from August’s 52.8 level. The lower-than-expected was pulled down by New Orders which fell back into contraction territory, though Production Growth pushed higher, and Inventories accelerated. Employment also fell into contraction territory. Inflation pressures continued to ease, with the Prices Index falling to 51.7 from 52.5. The ISM said, “The U.S. manufacturing sector continues to expand, but at the lowest rate since the pandemic recovery began.”
- The ISM Services PMI for September fell to 56.7, better than the expected decline to 56.0, and slightly better than the 56.9 in August, and still nowhere near recession levels. Economic activity in the services sector has now grown for 28 consecutive months. Employment, Imports, and New Export Orders all accelerated in the month, while Business Activity, New Orders, Supplier Deliveries, and Orders all slowed – but remained in growth territory. Additionally, Prices Paid continued to increase, but at a slower pace, and Inventories contracted at a faster pace than in August. The ISM said, “Based on comments from Business Survey Committee respondents, there have been improvements regarding supply chain efficiency, operating capacity, and materials availability; however, performance remains less than ideal. Employment continued to improve despite the restricted labor market.”
- The final September S&P Global U.S. Manufacturing PMI was revised up to 52.0, above the expectation for an unrevised 51.8 and August’s reading of 51.5 (readings above 50 denoting expansion). S&P Global’s report differs from the ISM in that it surveys a more diverse range of companies regarding the size.
- The final September S&P Global U.S. Services PMI rose to 49.3, more than the expected rise to 49.2, and above August’s 43.7. Despite the increase, the services PMI remains in contraction territory (below 50).
- August Factory Orders were unchanged from last month’s unrevised -1.0% decline, as expected, and Durable Goods Orders—preliminarily reported last week—remained at the previously reported -0.2% month-over-month decrease. Excluding transportation, orders were unexpectedly revised slightly up to +0.3%. The August final read on nondefense capital goods orders excluding aircraft—considered a proxy for capital spending—was revised up to a +1.4% increase for the month from +1.3% in the preliminary release.
- August Construction Spending declined -0.7% for the month, worse than expectations for a -0.3% decrease but better than July’s negatively revised 0.6% drop. Residential spending fell 1.0% m/m, while non-residential spending declined 0.4%.
- September Nonfarm Payrolls rose by 263,000 jobs, beating expectations of 255,000, while August remained unrevised at 315,000. Excluding government hiring and firing, private sector payrolls grew by 288,000, above expectations for 275,000, and the downwardly revised 275,000 from the initially reported 308,000 gain in August. The labor force participation rate slipped to 62.3% from the unrevised 62.4% in August, where it was expected to remain. The unemployment rate dipped to 3.5% from 3.7% in August, where it was expected to remain. Average hourly earnings were up +0.3% in the month, matching expectations and August’s unadjusted rate. Compared to last year, wages were up +5.0%, also matching expectations, and below August’s unrevised +5.2%. As expected, average weekly hours remained at 34.5.
- Consumer Credit came in at $32.2 billion during August, well above the $25.0 billion expected, while July’s figure was revised up to $26.1 billion from the originally reported $23.8 billion. Non-revolving debt—includes student loans and loans for vehicles and mobile homes—expanded by $15.1 billion, a +5.1% annual increase, while revolving debt—includes credit cards—rose $17.2 billion, up +18.1% from last year.
- The August Job Openings and Labor Turnover Survey (JOLTS), a measure of unmet demand for labor, showed a noticeable decline to 10.1 million jobs available to be filled, far below expectations of 11.1 million, and below July’s downwardly revised 11.2 million. The report showed the hiring rate was unchanged from July’s 4.1% level, and total separations—including quits, layoffs, discharges, and other separations—ticked slightly higher to 3.9% from July’s 3.8% rate. The quit rate for August remained at the prior month’s 2.7% pace.
- The weekly MBA Mortgage Application Index fell -14.2% from the prior week’s -3.7% gain. The Refinance Index plunged -17.8% from last week and the Purchase Index was down -12.6% for the week. The decrease came as the average 30-year mortgage rate rose 23 basis points to 6.75%, which is up +3.61 percentage points from last year.
- Weekly Initial Jobless Claims were 219,000 for the week ended October 1, higher than expectations of 204,000 and the prior week’s downwardly revised 190,000 (from 193,0000). Continuing Claims for the week ended September 24 rose by 15,000 to 1,361,000, higher than expectations of 1,370,750.
The Week Ahead
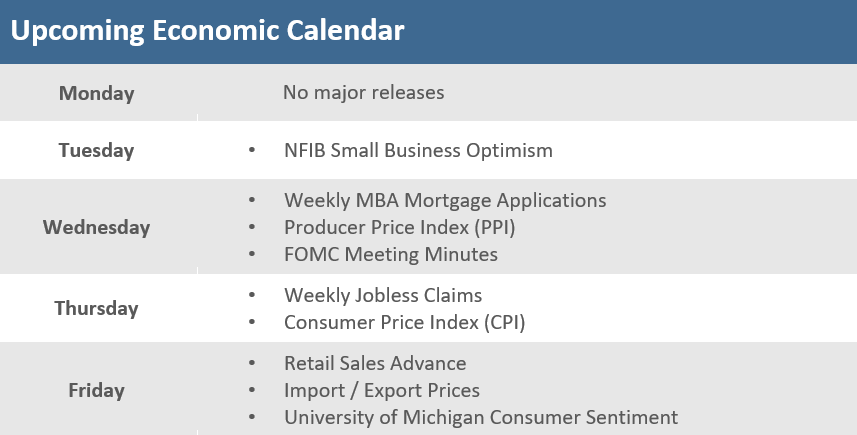
The upcoming week’s economic calendar will be lighter, but still include some key inflation reports with Producer Prices (PPI) and Consumer Prices (CPI) on Wednesday and Thursday, plus Import Prices on Friday. We’ll also get a look at how businesses and consumers are holding up with Small Business Optimism, Retail Sales, and Consumer Sentiment all due to the report. Even with a lighter economic calendar, Fed officials will likely continue to shape headlines and the Fed releases their minutes from the September FOMC meeting. The third quarter earnings season also kicks off with companies like Citigroup, JP Morgan, Morgan Stanley, Delta Air Lines, Domino’s Pizza, and PepsiCo all set to report profits.
Did You Know?
EMERGING MARKET BLUES – Emerging-market governments that issued debt in U.S. dollars will have to repay $86 billion of those U.S. dollar bonds by the end of next year. The dollar’s unrelenting and steep rise this year, combined with debt-market jitters, have sent the Bloomberg Emerging Markets Hard Currency Aggregate Index, a U.S. dollar-denominated emerging market debt benchmark, down -20.5% in 2022 through September (source: Dealogic, The Wall Street Journal, Bloomberg).
INVESTORS BEHAVING BADLY – As stocks and bonds slid in tandem in September, investors fled the market. About $81 billion was pulled from mutual and exchange-traded funds tied to stocks or bonds in September, including $40 billion in the month’s final week. The monthly outflow was greater than any monthly total since April’s $99 billion. Many investors have parked their money in cash. Over 21% of individual investors’ portfolios have been in cash since June. Those are the highest levels since April 2020 and above the average level of 17% going back to 2012 (source: Investment Company Institute, American Association of Individual Investors, The Wall Street Journal).
TGIF! – The stock market has performed unusually badly going into the weekend in 2022. 35% of trading days to end the week this year have seen the S&P fall 1% or more. That’s easily a record back to 1952 when the five-day trading week began. The only other years that come close were some of the worst years in the stock market’s history: 1974, 2000, 2002, and 2008. Not great company. Including Friday 10/7, we’ve already had 14 declines of 1% or more to end a trading week, which is just under the record of 15 for an entire year (1974 and 2008). With 12 more weeks left in 2022, we’ll need to see a meaningful shift in market sentiment for this dubious record not to be broken (Source: Bespoke Investment Group).
This Week in History
SPACE RACE – On October 4, 1957, the Union of Soviet Socialist Republics (USSR), launched Sputnik, the world’s first orbiting satellite, setting off a panic that the U.S. was falling behind in the space race. In the next 12 trading days, the Dow Jones Industrial Average lost 9.1% of its value (source: The Wall Street Journal).
Asset Class Performance
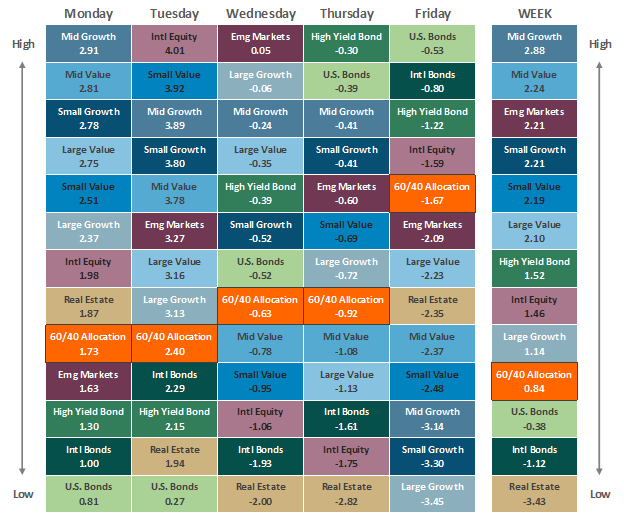
The Importance of Diversification. Diversification mitigates the risk of relying on any single investment and offers a host of long-term benefits, such as lowering portfolio volatility, improving risk-adjusted returns, and helping investments to compound more effectively.
Source: Bloomberg.
Asset‐class performance is presented by using market returns from an exchange‐traded fund (ETF) proxy that best represents its respective broad asset class. Returns shown are net of fund fees for and do not necessarily represent performance of specific mutual funds and/or exchange-traded funds recommended by The Retirement Planning Group. The performance of those funds may be substantially different than the performance of the broad asset classes and to proxy ETFs represented here. U.S. Bonds (iShares Core U.S. Aggregate Bond ETF); High‐Yield Bond (iShares iBoxx $ High Yield Corporate Bond ETF); Intl Bonds (SPDR® Bloomberg Barclays International Corporate Bond ETF); Large Growth (iShares Russell 1000 Growth ETF); Large Value (iShares Russell 1000 Value ETF); Mid Growth (iShares Russell Mid-Cap Growth ETF); Mid Value (iShares Russell Mid-Cap Value ETF); Small Growth (iShares Russell 2000 Growth ETF); Small Value (iShares Russell 2000 Value ETF); Intl Equity (iShares MSCI EAFE ETF); Emg Markets (iShares MSCI Emerging Markets ETF); and Real Estate (iShares U.S. Real Estate ETF). The return displayed as “Allocation” is a weighted average of the ETF proxies shown as represented by: 30% U.S. Bonds, 5% International Bonds, 5% High Yield Bonds, 10% Large Growth, 10% Large Value, 4% Mid Growth, 4% Mid Value, 2% Small Growth, 2% Small Value, 18% International Stock, 7% Emerging Markets, 3% Real Estate.
* The term basis points (bps) refers to a common unit of measure for interest rates and other percentages in finance. One basis point is equal to 0.01%. Bond prices and bond yields are inversely related. As the price of a bond goes up, the yield decreases.


