Quick Takes
- Markets whipsawed throughout the week as investors weighed inflation data that the Fed will weigh in its policy-making decisions. Both wholesale prices (Producer Price Index) and consumer (Consumer Price Index) came in higher than expected and core consumer inflation, which strips out food and energy, posted a 40-year high.
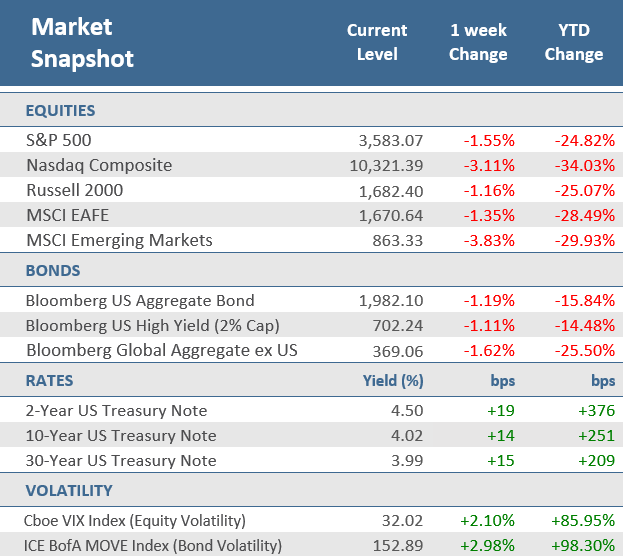
- The inflation concerns pressed the S&P 500 down early in the week, but on Thursday it made a surprise intraday reversal, the fifth largest in its history, to soar +2.6%. But it couldn’t sustain the gains on Friday and gave back -2.4%. For the week the S&P lost -1.6%, while the Nasdaq and Russell 2000 fell -3.1% and -1.2% respectively.
- Bonds also struggled with the inflation pressures as the yield on the 10-year US Treasury closed above 4.0% for the first time since October 2008, and the 2-year US Treasury yield rose another +19 basis points to 4.5%. The higher Treasury yields sent the Bloomberg U.S. Aggregate Bond Index down -1.2%, its tenth consecutive weekly decline.
Inflation concerns continue to weigh on stocks and bonds.
It was another wild week for the markets that ultimately closed down again for most major asset classes. Inflation fears and a rising U.S. dollar continue to take a toll on global stocks and bonds. Three of the major U.S. equity indices fell, with the tech-heavy Nasdaq falling the most, down -3.1%. Large cap U.S. stocks did better, but the S&P 500 was still down -1.6%. Smaller U.S. companies managed to lose the least, with the Russell 2000 slipping -1.2%. Overseas, developed markets (MSCI EAFE Index) fell -1.4%, while the MSCI Emerging Market Index dropped -3.8%.
Markets whipsawed throughout the week as investors weighed inflation data that the Fed will weigh in its policy-making decisions. Both wholesale prices (Producer Price Index) and consumer (Consumer Price Index) came in higher than expected and core consumer inflation, which strips out food and energy, posted a 40-year high. Initially, the inflation data weighed on the markets, but on Thursday stocks staged a big turnaround, the S&P 500 was up +2.6% on the day, which ended a six-day losing streak and put stocks in positive territory for the week. The Thursday rally was the fifth largest intraday turnaround from a low in the S&P’s history. However, stocks couldn’t sustain the gains on Friday as the S&P 500 sunk -2.4% to put it in the red for the week.
The hotter-than-expected inflation data took their toll on bond markets too. The 10-year U.S. Treasury bond yield closed above 4% for the first time since October 2008, up 14 basis points for the week, and marking 11 consecutive weeks of gains. Bond yields move inverse to price and one basis point is equivalent to 0.01%. The march higher in Treasury yields meant another down week for the Bloomberg U.S. Aggregate Bond Index, falling -1.2%, the tenth consecutive weekly decline.
On Wednesday the Federal Reserve released the minutes from its September monetary policy meeting where the Federal Open Market Committee (FOMC) raised the target for its fed funds rate by 75 bps for a third consecutive meeting. The primary takeaway is that Fed policymakers continue to agonize about persistent inflation, saying that it is “showing little signs so far of abating,” while reiterating that rate hikes are likely to continue, “raising its assessment of the path of the federal funds rate that would likely be needed to achieve the Committee’s goals.” They did, however, express optimism that the policy implementations should loosen the labor market and tame pricing pressures.
Last week marked the unofficial start to earnings season with the major banks reporting generally positive results. Of the seven banks reporting, five exceeded earnings per share (EPS) forecasts, one (Morgan Stanley) missed and one was inline (US Bancorp). According to Refinitiv, 2022-Q3 earnings are expected to be +3.6% over last year but excluding the energy sector, the annual earnings estimate falls to -3.1%. Thus far, 35 companies in the S&P 500 have reported earnings in Q3, and 68.6% have reported earnings above analyst estimates. That’s above the long-term average of 66.2%, but below the four-quarter average of 78.1%. Over the coming week 66 S&P 500 companies are set to report earnings, including Charles Schwab, United Airlines, Netflix, IBM, and Tesla. The peak weeks for earnings reports are still a couple of weeks away, coming between October 24 – November 11.
Chart of the Week
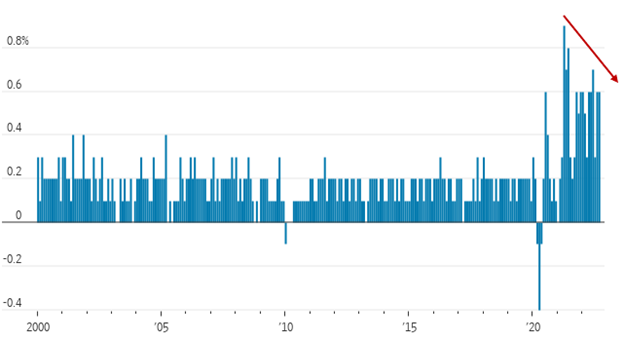
U.S. consumer inflation eased slightly in September as the headline Consumer Price Index (CPI) was up +8.2% over the last year, a bit higher than expectations of +8.1%, but down a tick from last month’s annual rate of +8.3%. However, on a month-over-month basis, headline CPI rose +0.4% in September, twice the expected rate of +0.2%, and well ahead of +0.1% in August. More concerning was that Core CPI, which excludes the more volatile food and energy components, accelerated to +6.6% in September from the year earlier, which was the biggest annual increase since August 1982 and higher than expectations of +6.5% as well as the +6.3% increase in August. Month-over-month, the core rate increased +0.6% in September, above expectations of a +0.4% rise, and matching August’s unadjusted gain. Prices rose last month for housing, medical care, airline fares, and other services, threatening to keep inflation high for a while. Though the annual core rate was at a new four-decade high in September, on a monthly basis, the core CPI rose 0.6% in September, the same as in August, and trending down since peaking at +0.9% in April 2021. Federal Reserve officials follow core inflation closely as a reflection of broad, underlying inflation and as a predictor of future inflation.
Core Exercise
U.S. Consumer Prices Index (CPI) excluding food and energy, 1-month change
Note: Seasonally adjusted.
Source: Labor Department, The Wall Street Journal.
Economic Review
- The Producer Price Index (PPI) for September rose +0.4% for the month, higher than expectations for a +0.2% gain, and August’s downwardly revised -0.2% decrease. Year-over-year, the headline PPI rate was +8.5% higher, ahead of expectations for +8.4%, but down from +8.7% in August. Core PPI, which excludes the more volatile food and energy components, was up +0.3% in September, in line with expectations and August’s negatively revised gain. Core PPI was up +7.2% for the year, less than the expected +7.3% rise and in line with August’s downwardly revised increase.
- The September National Federation of Independent Business (NFIB) Small Business Optimism Index unexpectedly rose to 92.1 from 91.8 in August, ahead of expectations for a decline to 91.6. The survey showed that 30% of business owners noted that inflation was their single most important problem in operating their business. The NFIB said, “Inflation and worker shortages continue to be the hardest challenges facing small business owners. Even with these challenges, owners are still seeking opportunities to grow their business in the current period.”
- The preliminary University of Michigan Consumer Sentiment Index for October was higher than expected, rising to 59.8 from September’s final reading of 58.6, above expectations for a slight increase to 58.8. The index continued to move off the record low seen in June as a noticeable increase in the current conditions portion of the index more than offset a decline in the expectations component of the report. The 1-year inflation outlook rose to +5.1% from +4.6% in September, and the 5-10-year inflation outlook rose to +2.9% from +2.7%.
- The September advance Retail Sales release showed flat month-over-month activity, below expectations for a +0.2% increase, and well below August’s downwardly revised +0.3% rise. Sales ex-autos were +0.1% higher, better than expectations of a -0.1% dip and August’s upwardly revised -0.1% decline. Sales ex-autos and gas were up +0.3%, also better than expectations which called for a +0.2% rise, but down from August’s upwardly revised +0.6% rise. The Control Group, a figure used to calculate GDP, was +0.4% higher for the month, higher than expectations for a +0.3% gain, and August’s upwardly revised +0.2% gain.
- The September Import Price Index fell by -1.2% for the month, a bit more than the expected -1.1% drop, and August’s negatively revised -1.1% decrease. Compared to last year, prices were up +6.0%, less than the expected +6.2% increase and August’s unrevised +7.8% rise.
- The weekly MBA Mortgage Application Index fell -1.8% from the prior week’s -14.2% plunge. The Refinance Index plunged -2.1% from last week and the Purchase Index was down -2.1% for the week. The decrease came as the average 30-year mortgage rate rose 6 basis points to 6.81%, which is up +3.63 percentage points from last year.
- Weekly Initial Jobless Claims were 228,000 for the week ended October 8, higher than expectations of 225,000 and the prior week’s unrevised 219,000. Continuing Claims for the week ended October 1 rose by 3,000 to 1,368,000, higher than expectations of 1,365,750.
The Week Ahead
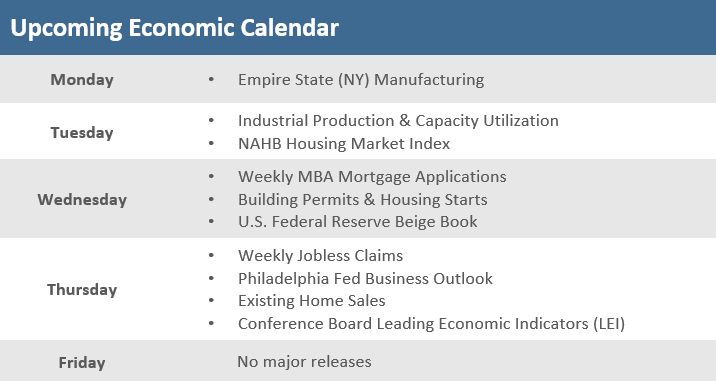
Housing will be a focus next week with the NAHB Housing Market Index, Building Permits and Housing Starts, Existing Home Sales, and weekly Mortgage Applications. On Wednesday we get the Fed’s Beige Book, which is an anecdotal read on national business activity used by policymakers to prepare for their next monetary policy decision (set for November 2). Thursday brings the Conference’s Boards Leading Economic Indicators Index. There will be some glimpse at factory activity the Fed’s Industrial Production and Capacity Utilization for September, as well as regional manufacturing surveys from New York and Philadelphia. Q3 earnings season will heat up and command some attention.
Did You Know?
YOU PROMISED – The “aggregate funded ratio” of state and local pension plans across America is 77.9%, i.e., the pension plan assets divided by the present value of the pension plan liabilities. Since 2001, the aggregate funded ratio has been as high as 95.1% (2001), as low as 62.4% (2009), and was 84.8% in 2021 (source: MFS, Equable Institute).
GOOD BUT NOT GREAT – U.S. energy forecasters’ latest estimate for domestic oil production next year would be a record, topping 2019’s 12.3 million barrels a day. But it would also be about half the year-over-year increase that the U.S. Energy Information Administration expected this summer (source: The Wall Street Journal).
NOT TRUSTED – 63% of 2,005 registered voters surveyed in January 2022 support a complete ban on stock trading for all members of Congress (source: MFS, Morning Consult –Politico).
This Week in History
DOW 6K – On October 14, 1996, the Dow Jones Industrial Average reached 6,000 for the first time. It took the Dow about 11 months to make the +20% gain from hitting 5,000 for the first time to reaching 6,000. Incredibly, it took only another four months for the Dow to hit 7,000 as the dot-com bubble started to inflate. The Dow continued to knock down milestone after milestone in the years that followed before finally peaking at its dot-com boom peak of 11,750 in January of 2000. The Dow closed the week at 29,634.83, which is -18.5% below its all-time high of 36,799.65 set on January 4, 2022. The Dow’s total return (i.e. including dividends reinvested) from 10/14/1996 to 10/14/2022 was +793% or about +8.8% per year (source: Benzinga, Bloomberg).
Asset Class Performance
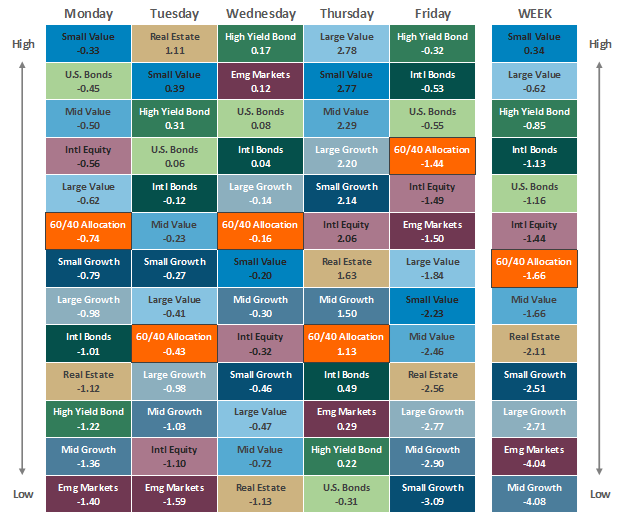
The Importance of Diversification. Diversification mitigates the risk of relying on any single investment and offers a host of long-term benefits, such as lowering portfolio volatility, improving risk-adjusted returns, and helping investments to compound more effectively.
Source: Bloomberg.
Asset‐class performance is presented by using market returns from an exchange‐traded fund (ETF) proxy that best represents its respective broad asset class. Returns shown are net of fund fees for and do not necessarily represent performance of specific mutual funds and/or exchange-traded funds recommended by The Retirement Planning Group. The performance of those funds may be substantially different than the performance of the broad asset classes and to proxy ETFs represented here. U.S. Bonds (iShares Core U.S. Aggregate Bond ETF); High‐Yield Bond (iShares iBoxx $ High Yield Corporate Bond ETF); Intl Bonds (SPDR® Bloomberg Barclays International Corporate Bond ETF); Large Growth (iShares Russell 1000 Growth ETF); Large Value (iShares Russell 1000 Value ETF); Mid Growth (iShares Russell Mid-Cap Growth ETF); Mid Value (iShares Russell Mid-Cap Value ETF); Small Growth (iShares Russell 2000 Growth ETF); Small Value (iShares Russell 2000 Value ETF); Intl Equity (iShares MSCI EAFE ETF); Emg Markets (iShares MSCI Emerging Markets ETF); and Real Estate (iShares U.S. Real Estate ETF). The return displayed as “Allocation” is a weighted average of the ETF proxies shown as represented by: 30% U.S. Bonds, 5% International Bonds, 5% High Yield Bonds, 10% Large Growth, 10% Large Value, 4% Mid Growth, 4% Mid Value, 2% Small Growth, 2% Small Value, 18% International Stock, 7% Emerging Markets, 3% Real Estate.
* The term basis points (bps) refers to a common unit of measure for interest rates and other percentages in finance. One basis point is equal to 0.01%. Bond prices and bond yields are inversely related. As the price of a bond goes up, the yield decreases.


