Quick Takes
- Stocks and bonds were battered for a second straight week after the Federal Reserve raised the Fed Funds rate by 75 basis points for the third straight time. Though the rate hike was expected, the Fed’s accompanying statement and post-hike announcements were more aggressive than markets anticipated.
- For the week, the S&P 500 Index fell -4.7%, and the Bloomberg U.S. Aggregate Bond Index was down -1.6%. Overseas returns were hit even harder as global central banks tried to keep pace with the Fed and U.S. rates. In addition, the U.S. dollar hit a 20-year high. The MSCI All Country World (ACWI) ex U.S. Index fell -5.3% for the week and the Bloomberg Global Aggregate Bond ex U.S. Index was down -3.2%.
- In addition to the aggressive Fed and other global central banks, markets were rattled by economic data that was weakening. The Conference Board’s Leading Economic Index (LEI), meant to show turning points in the economy, fell more than expected. Housing data also continued to decelerate, on average, though not as badly as expected.
Hawkish Fed punishes stocks and bonds further.
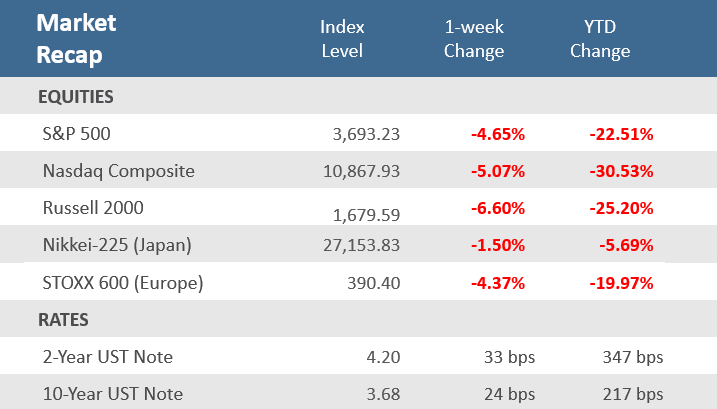
For a second straight week, stocks posted solid losses, and bond yields surged in the wake of the Federal Open Market Committee’s (FOMC) decision to hike the fed funds rate by 75 basis points (bps)* for the third consecutive time. Though that was the expected amount for the Fed to raise rates, the FOMC also raised its projections for the path of future rate hikes—known as the “dots plot”—by an additional 125 bps by year-end and for the terminal rate to peak at 4.6% by the end of 2023, far above earlier estimates. In its statement, the Committee noted that spending and production have indicated modest growth, job gains remain robust and the unemployment rate continues to be low. However, inflation remains elevated, citing supply and demand imbalances related to the pandemic, as well as higher energy and food prices. Remarks by Federal Reserve Chairman Jerome Powell following the rate announcement solidified the belief that the Fed’s primary concern is inflation, and the central bank is willing to impose financial pain to bring it down. Investors are increasingly believing him as stocks sank, Treasury yields soared, and the U.S. dollar continued to rally, hitting new 20-year highs. For the major U.S. equity indexes, it was the fifth week of declines in the last six, with the S&P 500 down -4.7%, the Nasdaq Composite off -5.1%, and the small-cap Russell 2000 Index down -6.6%. In just the last two weeks, the S&P is down -9.2%, bringing the year-to-date losses to -23% from its January 4th peak, just above the June 16th -23.6% drawdown.
Regarding its balance sheet, the Fed said it will maintain its plans of reducing its holdings of Treasury securities and agency debt, and agency mortgage-backed securities that it released in May. The decision was unanimous among Committee members. The policy-sensitive 2-year Treasury note yield jumped 33 bps for the week to close at 4.20%, a 15-year high, while the 10-year Treasury yield rose 24 bps over the week, to 3.68%, its highest level in 11 years. That put the yield curve inversion (when shorter-term government bonds have higher yields than long-term bonds) at 52.7 bps, its deepest inversion since 2000 and a further indication that the markets are pricing in a possible future recession. Unlike 2000 though, the yield curve for the 3-month and 10-year Treasury notes has yet to invert, with it still standing at a positive 48.7. The soaring yields left the Bloomberg Aggregate Bond Index down -1.6% for the week.
It wasn’t just the Fed hiking rates during the week. Central banks around the world raced to keep up with the Fed’s rate increases. The Bank of England (50 bps), the Swiss National Bank (75 bps), Norway’s Norges Bank (50 bps), and the central banks of Taiwan (12.5 bps), the Philippines (50 bps), and South Africa (75 bps) all raised their policy rates on Thursday. On Tuesday, Sweden’s Riksbank raised its policy rate by a more-than-expected 100 bps to 1.75%. Like the U.S. market, global stocks and bonds sank in the wake of the hawkishness, with the MSCI All Country World (ACWI) ex-United States Index down -5.3% for the week and the Bloomberg Global Aggregate Bond ex-United States Index down -3.2%. Non-U.S. stocks and bonds suffered not just from the aggressive central banks, but also from the rising U.S. dollar which was up more than +3% last week against a basket of other major world currencies, leaving it at its highest level since 2002.
Chart of the Week
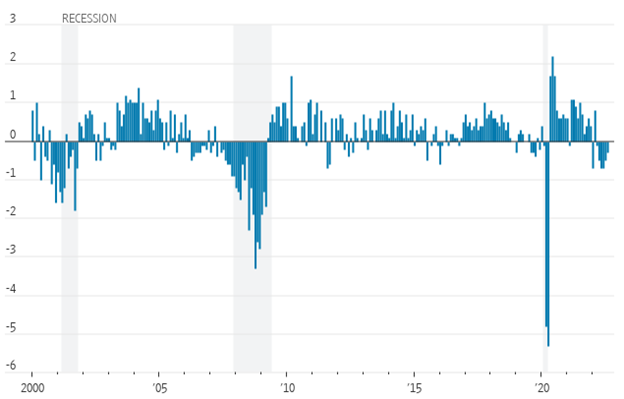
The Conference Board’s Leading Economic Index (LEI), meant to show turning points in the economy, fell -0.3% for the month of August, more than the expected -0.1% decline, but better than July’s negatively revised -0.5% drop. It was the sixth consecutive negative drop, as ISM new orders, building permits, consumer expectations, and average workweek all fell, more than offsetting gains in jobless claims, stock prices, and the interest rate spread. Wells Fargo economist Tim Quinlan said, “August’s decline in the Leading Economic Index pushed the six-month average change below a level historically indicative of a coming recession. The trend decline in the LEI since the start of the year is consistent with our view that the economy will slip into a mild recession by the beginning of next year.”
Flashing A Warning
Leading Economic Index for the U.S., change from the prior month
Sources: The Conference Board, The Wall Street Journal.
Economic Review
- The September preliminary S&P Global U.S. Manufacturing PMI Index unexpectedly increased to 51.8 from August’s unrevised 51.5 figure and versus estimates of a slight decrease to 51.1. The preliminary S&P Global U.S. Services PMI Index also surprised to the upside, as the key U.S. sector in September rose to 49.2, compared to expectations of a modest gain to 45.0 from August’s 43.7 figure. The manufacturing PMI moved further into expansion territory, while the services PMI remained in contraction territory, with 50 being the demarcation point between the two zones.
- The September Kansas City Fed Manufacturing Activity Index declined unexpectedly but remained in expansion territory (a reading above zero). The index dropped to 1 from 3 in August (unrevised), which was well below forecasts for an increase to 5.
- Homebuilder sentiment fell more than expected and to a level suggesting poor conditions (a reading below 50) as the National Association of Home Builders (NAHB) Housing Market Index (HMI) dropped to 46 in September from August’s unrevised 49. Expectations were for a decline to 47. This was the second-straight month that homebuilder sentiment was below 50 after falling for nine-straight months. The NAHB said, “Buyer traffic is weak in many markets as more consumers remain on the sidelines due to high mortgage rates and home prices that are putting a new home purchase out of financial reach for many households.” The NAHB added that, “builder sentiment has declined every month in 2022, and the housing recession shows no signs of abating as builders continue to grapple with elevated construction costs and an aggressive monetary policy from the Federal Reserve that helped pushed mortgage rates above 6% last week, the highest level since 2008.”
- August Housing Starts soared +12.2% for the month to an annual pace of 1,575,000 units, far above expectations for a +0.3% rise to a 1,450,000-unit pace and July’s downwardly revised -10.9% decline to 1,404,000 units. Building Permits, one of the leading indicators tracked by the Conference Board as it is a gauge of future construction, dropped by -10.0% for the month to an annual rate of 1,517,000, well below expectations for a -4.8% drop to 1,604,000 units, and the unrevised 1,674,000-unit pace in July.
- August Existing Home Sales were down -0.4% for the month to an annual rate of 4.80 million units, beating expectations for a -2.3% decrease to a 4.70-million-unit pace. July’s level was adjusted slightly higher to 4.82 million units. Contract closings fell for the seventh-straight month, remain at the lowest level since May 2020, and are down nearly -20.0% versus a year ago. The Median Existing Home Price was up +7.7% from a year ago to $389,500—the 126th straight annual gain—but was the second month in a row that the median sales price decelerated from the record high of $413,800 in June. The number of Homes for Sale declined from last month, and at the current sales pace, it would take 3.2 months to sell all the houses on the market, after five successive monthly increases, but up from the 2.6 months pace in the same period last year. Existing home sales account for a large majority of the home sales market and reflect contract closings instead of signings.
- The weekly MBA Mortgage Application Index rose for the first time in six weeks, up +3.8% from the prior week’s -1.2% decline. The Refinance Index jumped +10.4% from last week and the Purchase Index was up +1.0% for the week. The increase came even as the average 30-year mortgage rate rose 24 basis points to 6.25%, which is up +3.22 percentage points from last year.
- Weekly Initial Jobless Claims were 213,000 for the week ended September 17, under expectations of 217,000, but above the prior week’s downwardly revised 208,000 (from 213,0000). Continuing Claims for the week ended September 10 fell 22,000 to 1,379,000, below expectations of 1,418,000.
The Week Ahead
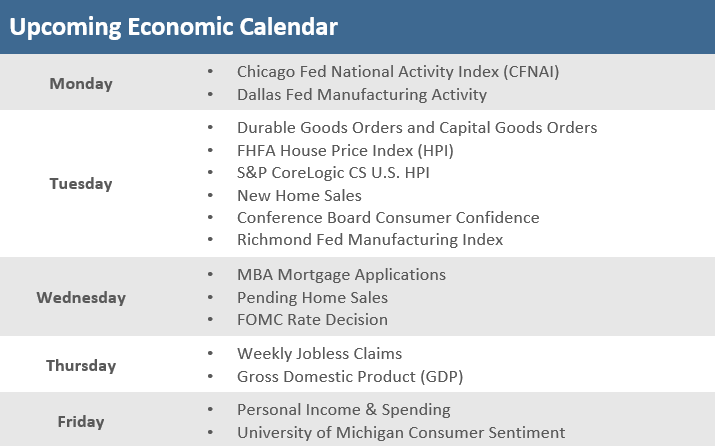
The upcoming week’s economic calendar is busier than it’s been for several weeks. Housing data will be prevalent and includes reports on home prices by the FHFA and by S&P Global, new and pending home sales, and weekly mortgage applications. A peek at the all-important consumer is also on tap, with the Conference Board’s September Consumer Confidence Index, the final read on consumer sentiment from the University of Michigan, and the personal income and spending release on Friday. Of course, the final look at Q2 GDP on Thursday will be watched. A few regional Fed manufacturing reports, specifically Richmond, Dallas, and Chicago, will be reported.
Did You Know?
SUPERSIZE ME – On Tuesday, September 20, Sweden’s Riksbank, the Swedish central bank, raised its policy rate by a supersized 1 percentage point, to 1.75%, its biggest increase in decades. Then, on what was dubbed “Super Thursday”, several other world central banks raised rates by more than expected. The Bank of England raised its key interest rate for the seventh consecutive time, by 0.5 point to 2.25%, and will start selling some of its bond holdings. Norway increased rates by 0.5 percentage points to 2.25%. Indonesia and the Philippines both raised their benchmark rates by 0.5 percentage points to 4.25%. Taiwan hiked its discount rate up by 0.125 percentage points to 1.625%. South Africa raised its rate up 0.75 points to 6.25% (source: The Wall Street Journal).
NEGATIVE NO LONGER – Also on Super Thursday, the Swiss National Bank raised its key policy rate to 0.5% from -0.25%, marking an end to Europe’s last remaining negative-rates experiment. The Swiss National Bank’s benchmark lending rate was below 0% since 2014 (source: The Wall Street Journal).
NOT ALL HIKED – Not all global central banks hiked rates at their September meetings. The Bank of Japan left its policy rate unchanged at its previous low level, though they did take some policy action—announcing it intervened in currency markets to sell dollars and buy yen, the first such intervention in 24 years, an effort to slow the recent fall in the Japanese currency. Turkey cut its rate to 12% from 13%, despite inflation surpassing 80% in August and prompting a renewed slide in the value of its currency (source: The Wall Street Journal).
This Week in History
NOT MUCH BETTER NOW – On September 19, 1974, U.S. Secretary of the Treasury William E. Simon predicted that interest rates, then around 8%, would soon fall. The Dow leapt +3.4% on the perceived good news. However, over the next seven years, interest rates proceeded to double. Today’s policymakers aren’t much better at forecasting rates. One year ago, the Fed was signaling rates might stay near zero for another year, badly misjudging the strength of the economy’s rebound from the pandemic and how high inflation would rise. They are now raising rates at the most rapid pace since the 1980s and have approved increases at the last five consecutive policy meetings (source: The Wall Street Journal).
Asset Class Performance
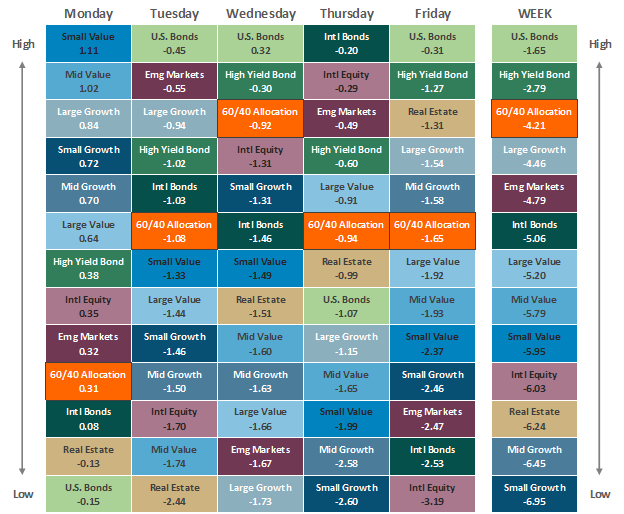
The Importance of Diversification. Diversification mitigates the risk of relying on any single investment and offers a host of long-term benefits, such as lowering portfolio volatility, improving risk-adjusted returns, and helping investments to compound more effectively.
Source: Bloomberg.
Asset‐class performance is presented by using market returns from an exchange‐traded fund (ETF) proxy that best represents its respective broad asset class. Returns shown are net of fund fees for and do not necessarily represent performance of specific mutual funds and/or exchange-traded funds recommended by The Retirement Planning Group. The performance of those funds may be substantially different than the performance of the broad asset classes and to proxy ETFs represented here. U.S. Bonds (iShares Core U.S. Aggregate Bond ETF); High‐Yield Bond (iShares iBoxx $ High Yield Corporate Bond ETF); Intl Bonds (SPDR® Bloomberg Barclays International Corporate Bond ETF); Large Growth (iShares Russell 1000 Growth ETF); Large Value (iShares Russell 1000 Value ETF); Mid Growth (iShares Russell Mid-Cap Growth ETF); Mid Value (iShares Russell Mid-Cap Value ETF); Small Growth (iShares Russell 2000 Growth ETF); Small Value (iShares Russell 2000 Value ETF); Intl Equity (iShares MSCI EAFE ETF); Emg Markets (iShares MSCI Emerging Markets ETF); and Real Estate (iShares U.S. Real Estate ETF). The return displayed as “Allocation” is a weighted average of the ETF proxies shown as represented by: 30% U.S. Bonds, 5% International Bonds, 5% High Yield Bonds, 10% Large Growth, 10% Large Value, 4% Mid Growth, 4% Mid Value, 2% Small Growth, 2% Small Value, 18% International Stock, 7% Emerging Markets, 3% Real Estate.
* The term basis points (bps) refers to a common unit of measure for interest rates and other percentages in finance. One basis point is equal to 0.01%. Bond prices and bond yields are inversely related. As the price of a bond goes up, the yield decreases.


