Market Performance Summary
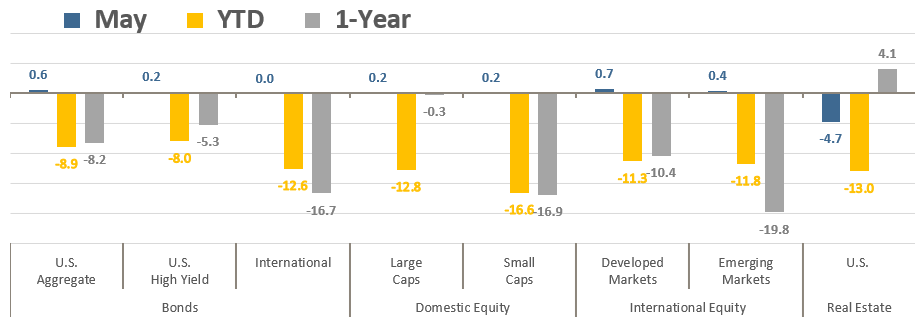
May finally brought a reprieve from 2022’s negative returns, but investors may be forgiven if they have to squint to see them. As shown in the table below, most major asset classes had positive returns for the month of May, albeit all less than +1%. Real Estate was the exception, with a loss of -4.7%. Still, for some like Emerging Markets equities and High Yield bonds it was the first positive month of the year. The market storylines haven’t changed much with the Fed’s monetary tightening actions, inflation pressures, the ongoing war in Ukraine, and China’s COVID lockdowns still dominating the headlines. However, the persistence of all these concerns, combined with the choppy, back-and-forth market swings virtually every day, has led to a palpable increase in recession fears.
Asset Class Total Returns
Source: Bloomberg, as of May 31, 2022. Performance figures are index total returns: U.S. Bonds (Barclays U.S. Aggregate Bond TR), U.S. High Yield (Barclays U.S. HY 2% Issuer-Capped TR), International Bonds (Barclays Global Aggregate ex USD TR), Large Caps (S&P 500 TR), Small Caps (Russell 2000 TR), Developed Markets (MSCI EAFE NR USD), Emerging Markets (MSCI EM NR USD), Real Estate (FTSE NAREIT All Equity REITS TR).
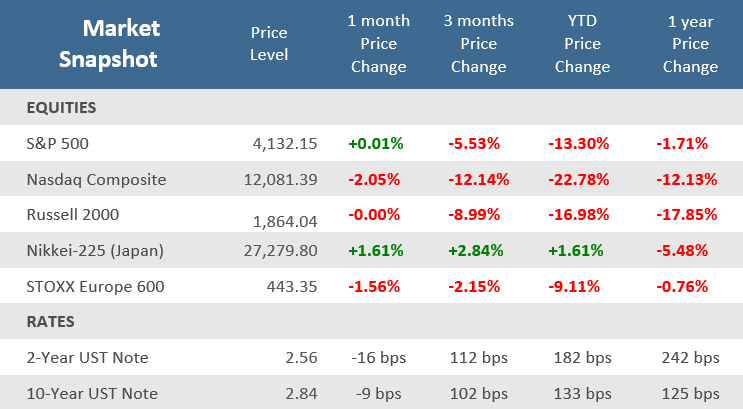
It was just a month ago that the S&P 500 suffered a -8.7% decline, the worst month since March 2020, so even a modest +0.2% return in May felt welcoming. That may be especially so given that it was only the second positive month of the year and the fact that U.S. equities were sharply lower earlier in the month before a nice rally materialized in the final week. And it was quite the move with S&P 500 gaining more than +6% for its best one-week gain since the first week of November 2020 (Election Week). At one point on May 20th the S&P 500 was trading in bear market territory (a decline of -20% or worse from its all-time high on January 4th), but a final hour rally that afternoon kept the index from closing under bear levels.
What was the catalyst for the rebound at the end of May? It’s hard to say, economic data generally came in weaker than expected, earnings reports came in slightly higher than expected yet still decelerated, and inflation remains historically high. However, inflation does look like it may have stabilized, and perhaps is rolling over. As a result, bond yields have stopped rising, and the Fed became a bit more dovish in response to the economic data slowing and persistent geopolitical tensions. The Federal Reserve did stay true to its projections and increased the fed funds rate by 50 basis points in May, the first 50bps hike since 2000. But they also disavowed the markets of any expectations that it may hike by 75bps, and some Fed members suggested it may make sense to pause in September.
With the market relenting in its expectations on how aggressive the Fed will be through the end of 2022 and 2023, the benchmark 10-year U.S. Treasury yield declined -9bps in May, helping the Bloomberg US Aggregate Bond Index eke out a +0.6% gain in May, its first positive month in the last six, breaking its longest consecutive monthly losing streak since 1994.
Source: Bloomberg.
Quick Takes
Economic Recession?
The U.S. economy is showing signs that the post pandemic surge is beginning to moderate, but that doesn’t mean a recession is imminent. Yes, inflation is the worst it’s been in decades, interest rates are rising, geopolitical tensions remain high, stocks flirted with bear market levels, and consumer sentiment has soured to levels not seen in more than ten years. A commonly accepted definition or recession is two consecutive quarter of negative GDP growth. However, the National Bureau of Economic Research (NBER) is the official scorekeeper for U.S. recessions, and they define recession as “a significant decline in economic activity that is spread across the economy and that lasts more than a few months…these include real personal income less transfers, nonfarm payroll employment, real personal consumption expenditures, wholesale-retail sales adjusted for price changes, employment as measured by the household survey, and industrial production”. J.P. Morgan looked at the NBER definition and applied it to recent economic data that shows:
- Monthly nonfarm payroll growth has averaged over 550,000 in the past 6 months, signaling very strong demand for labor and a robust job market.
- Real personal income excluding transfers fell -0.3% in March but is +1.9% higher relative to a year ago and +1.2% higher relative to the pre-pandemic peak.
- Real consumer spending expanded +0.2% in March as consumers continue to shift from buying goods to paying for services.
- Industrial production rose +1.1% in April, aided by a +0.8% increase in manufacturing output.
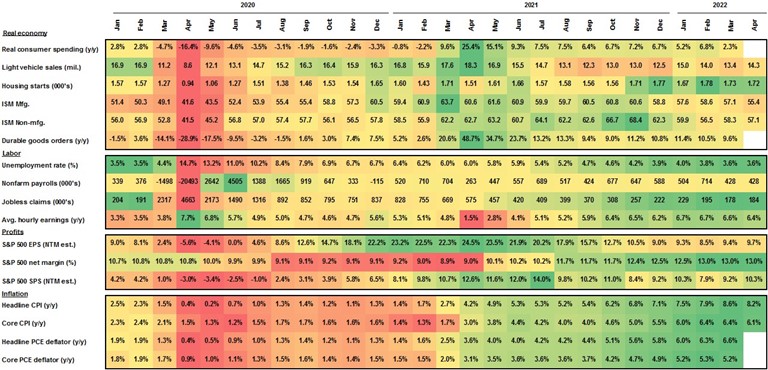
The conclusion is that economy is still very much in expansion mode and therefore a recession is not imminent. The table below is an even broader look at U.S. economic variables. Don’t worry about all the details, it is a heatmap table and anything in red represent contracting data (bad) and green is improving data (good), while yellow is neutral. The inflation data are dark green and that increases risks as the Fed must respond to it increasing too much, but all the other real economy, labor market, and corporate profit elements are mostly green as well. That suggests that the economy continues to expand at a healthy, albeit slower, pace. It certainly isn’t anything resembling the orange and red that dominates recessionary contraction.
U.S. Economic Heatmap
Source: BEA, BLS, Department of Labor, Census Bureau, Standard & Poor’s, Institute for Supply Management, FactSet, J.P. Morgan Asset Management. S&P 500 EPS (earnings per share) and SPS (sales per share) are expected earnings and sales per share growth over the next 12 months. Data are as of May 17, 2022.
Earnings Recession?
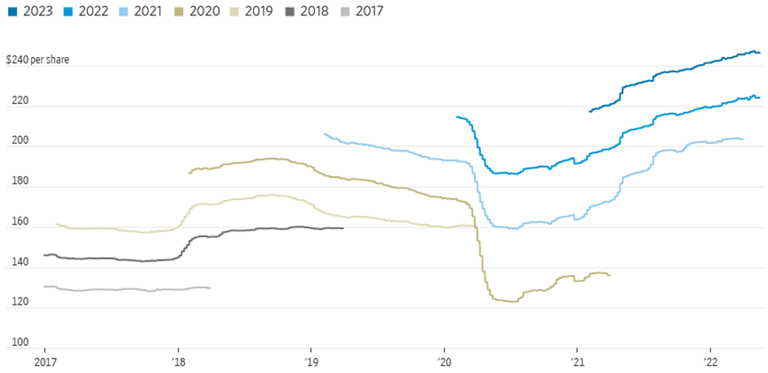
Worries over recession are reflected in stock prices but not earnings data yet. For all the talk about economic recession, corporate earnings aren’t reflecting great risk. With all but 5 companies in the S&P 500 having now reported Q1-2022 earnings, Refinitiv expects year-over-year earnings growth to be +11.3%. Of those that have reported, 77.4% beat analysts’ expectations, well above the long-term average of 66%. At the end of May, the S&P 500 was -13.3% below its all-time high (set on January 4th), but analysts so far aren’t lowering their estimates for earnings. Bespoke Investment Group reports that aggregate forward earnings per share estimates for the S&P 500 have continued to rise and are up +7% on a year-to-date basis to 134.9, a record high. With stock prices down and earnings rising, the trailing 12-month price-to-earnings ratio, a measure of stock valuation, have decreased about -36% from their peak in 2020.
Earnings Don’t Scream Recession
Forecast S&P 500 Earnings Per Share by Calendar Year
Source: Refinitiv, The Wall Street Journal.
Easy Money Era Over
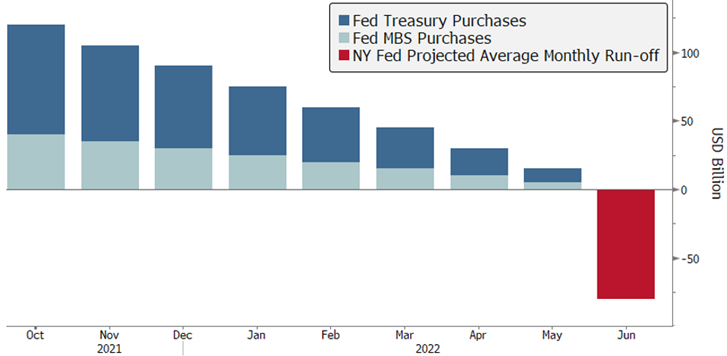
Much of the focus on the Federal Reserve’s shift from Quantitative Easing (in response to the outbreak of COVID in early 2020) to Quantitative Tightening has been on its expected rate hikes. However, part of the Fed’s accommodative monetary policy to help juice the recovery from COVID has been the expansion of its balance sheet, primarily through purchase of Treasury bonds and Mortgage Backed Securities (MBS) in the open market. Of course, we’ve already seen the Fed begin its rate hikes, but in June the Fed will move from not just slowing the pace of its asset purchases from the early stages of the pandemic, but the first reduction of those securities from its balance sheet. The Fed’s balance sheet swelled from about $3.76 trillion in the fall of 2019 to $8.97 trillion at its peak on April 20th. That was an unprecedented rise in the size of the Fed’s balance sheet, and the rolling off of those assets is also unprecedented, other than a brief attempt at reducing its bond portfolio in 2018 before it was quickly halted. Sensible monetary policy should allow the prevent recession, but this is a wildcard risk that we will be watching closely.
The Fed’s Balance Sheet Begins to Shrink
NY Fed projects Balance sheet to fall by an average $80 billion per month through 2024
Source: Federal Reserve, Bloomberg.
Pain at the Pump
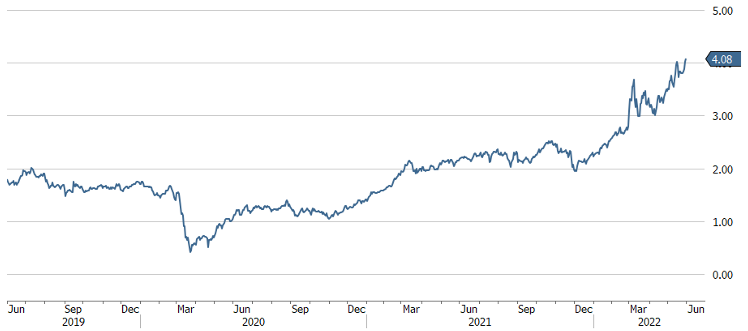
Rising fuel prices are a big component of inflation, and that is likely to continue this summer with prices remaining elevated even after driving season peaks in July. Gasoline experts see prices rising to $5 or more per gallon, and JPMorgan analysts are even forecasting a national average of $6.20 per gallon in August, as uncertainty about Russia and tight supply pressures prices. For the first time ever, the average price for unleaded gasoline hit $4 per gallon or greater in all 50 states in May, AAA data shows. In an average summer, gas prices rise as the summer driving season kicks off on Memorial Day weekend, and peaks in July — just after the Fourth of July holiday.
Yardeni Research projects households are spending the equivalent of $5,000 a year on gasoline, compared with $2,800 a year ago. This is factor that could detract from consumer spending in other areas, but so far retail spending and travel are holding up.
Gasoline Could Top $5 a Gallon this Summer, Causing More Pain for Consumers
RBOB Gasoline Futures 3-Year Chart
Source: Bloomberg, CNBC.
Energy Costs are Up, but so are Wages and Wealth
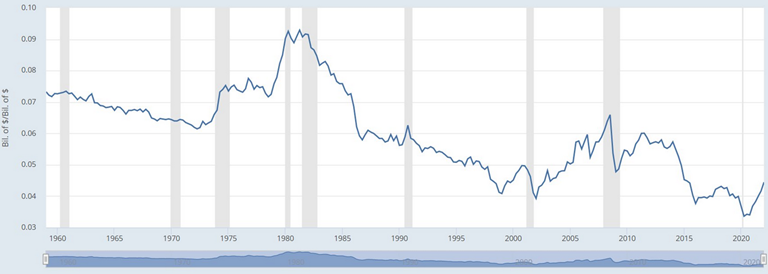
As we all know, and as it is shown in the gasoline prices chart in the previous section, gas and energy prices are sharply higher in 2022. However, consumers are still spending, companies are still hiring, and unemployment remains historically low. Yes, inflation is high, particularly with the key food and energy components that most people see and feel on a daily or weekly basis. But that doesn’t make it recessionary, but likely makes it a big contributor to people’s sense of pessimism. Nevertheless, only about 5% of consumption currently goes to energy goods and services, and despite peaking at more than 9% in the early 1980s, the average since the 1950s is 6%. The most recent spike was in 2008 when the cycle peaked at about 7% of consumption spent on energy. Inflation is miserably high now, but the burden still isn’t anything like the 1980s or even the Global Financial Crisis. The Fed has made it clear that they are committed to bringing down inflation, while higher prices themselves also typically result in lower consumption (as they say “the best cure for high prices is high prices”). If inflation can be eased organically through more supply of goods (and the supply chain disruptions show some signs of improvement) and more workers being hired, in combination with a measured pace of Fed tightening, then it is possible for inflation to decline without a recession. If inflation is only reduced through heavy Fed action, then the risk of recession will likely be greater.
Energy Cost Burden Rises, but Remains Low Historically
Person Consumption Expenditures: Energy Goods and Services / Overall Personal Consumption Expenditures
Source: U.S. Bureau of Economic Analysis, LPL Research.
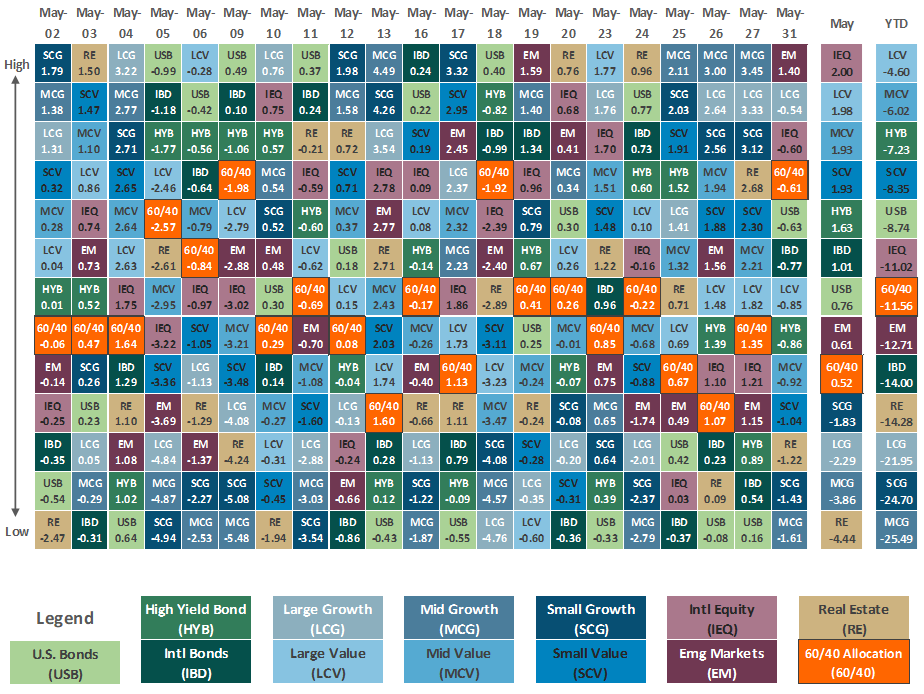
Asset Class Performance
The Importance of Diversification. Diversification mitigates the risk of relying on any single investment and offers a host of long-term benefits, such as lowering portfolio volatility, improving risk-adjusted returns, and helping investments to compound more effectively.
Source: Bloomberg. Asset‐class performance is presented by using market returns from an exchange‐traded fund (ETF) proxy that best represents its respective broad asset class. Returns shown are net of fund fees for and do not necessarily represent performance of specific mutual funds and/or exchange-traded funds recommended by The Retirement Planning Group. The performance of those funds may be substantially different than the performance of the broad asset classes and to proxy ETFs represented here. U.S. Bonds (iShares Core U.S. Aggregate Bond ETF); High‐Yield Bond (iShares iBoxx $ High Yield Corporate Bond ETF); Intl Bonds (SPDR® Bloomberg Barclays International Corporate Bond ETF); Large Growth (iShares Russell 1000 Growth ETF); Large Value (iShares Russell 1000 Value ETF); Mid Growth (iShares Russell Mid-Cap Growth ETF); Mid Value (iShares Russell Mid-Cap Value ETF); Small Growth (iShares Russell 2000 Growth ETF); Small Value (iShares Russell 2000 Value ETF); Intl Equity (iShares MSCI EAFE ETF); Emg Markets (iShares MSCI Emerging Markets ETF); and Real Estate (iShares U.S. Real Estate ETF). The return displayed as “Allocation” is a weighted average of the ETF proxies shown as represented by: 30% U.S. Bonds, 5% International Bonds, 5% High Yield Bonds, 10% Large Growth, 10% Large Value, 4% Mid Growth, 4% Mid Value, 2% Small Growth, 2% Small Value, 18% International Stock, 7% Emerging Markets, 3% Real Estate.
Chris Bouffard is CIO of The Retirement Planning Group (TRPG), a Registered Investment Adviser. He has oversight of investments for the advisory services offered through TRPG.
Disclaimer: Information provided is for educational purposes only and does not constitute investment, legal or tax advice. All examples are hypothetical and for illustrative purposes only. Past performance of any market results is no assurance of future performance. The information contained herein has been obtained from sources deemed reliable but is not guaranteed. Please contact TRPG for more complete information based on your personal circumstances and to obtain personal individual investment advice.

