Quick Takes
- The broad U.S. equity indexes closed higher for a second week in a row, with the S&P notching its best two-week performance since late 2020. A rebound in technology led to the relief rally, and the Nasdaq Composite advanced more than +10% over the last two weeks.
- Treasury yields also continued to rise as Fed Chair Jerome Powell asserted during the week that the Fed was ready to take action to combat the surge in inflation. The yield on the benchmark 10-year U.S. Treasury note hit a fresh two-year high Friday, climbing as high as 2.503%, its highest level since May 2019, before settling to 2.47 at the close.
- Economic data was mixed, with lower-than-expected weekly unemployment claims and better-than-expected manufacturing PMIs and regional Fed economic activity indices. But new and pending home sales unexpectedly declined, and consumer sentiment sank.
Stocks Have Their Best Two-Week Gain Since Late 2020
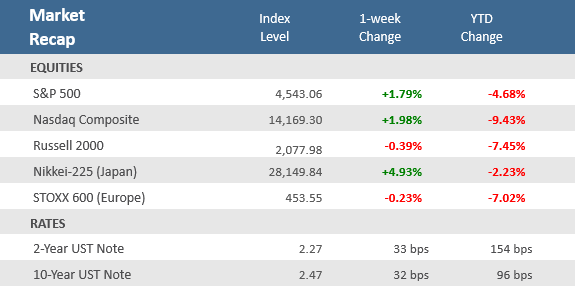
The broad U.S. equity indexes pushed higher for a second week in a row. The S&P 500 gained +1.8% over the week, pushing its two-week advance to +8.1%, the best since late 2020. The technology-heavy Nasdaq Composite rose +2%, extending its two-week gain to more than +10%. Even some overseas markets got in on the fun. Japan’s Nikkei-225 was up +4.9% this week on top of last week’s +6.6% rise. U.S. Small-cap stocks and European stocks couldn’t keep up, though, as the Russell 2000 fell -0.4% leaving its two-week return at about +5%, and the STOXX 600 European index slipped -0.2% after last week’s +5.4% gain. The rise of most equity benchmarks came despite casualties mounting in the Russia-Ukraine war and indications that the Fed will be increasingly aggressive with its monetary tightening campaign. The latter was evident as yields on short- and medium-term Treasurys, which are most responsive to Fed policy, rose more than those on longer-term bonds. Indeed, Fed Chair Jerome Powell vowed in a couple of speeches during the week to take action on inflation that he said jeopardizes an otherwise strong economic recovery. As seen in the table above, yields on the 2-year U.S. Treasury note moved up 33 basis points to 2.27%, while the yield on the 10-year note was up 32 basis points to 2.5%, its highest level since May 2019 and likely a reflection that investors are ratcheting up their interest rate expectations.
Economic data was light and mixed for the week. A larger-than-expected decline in weekly unemployment claims sent them to their lowest level since 1969, and continuing claims dropped to their lowest level since January 1970, showing that the labor market is still very strong. Other positives included better-than-expected preliminary global manufacturing and services reports and further expansion in regional Fed economic activity indices. Housing data was a bit disappointing as the recent spike in interest rates appears to be hindering sales, as new and pending home sales both missed expectations with declines, while mortgage applications fell. According to Mortgage News Daily, the average rate on 30-year fixed mortgages shot significantly higher Friday, rising 24 basis points to 4.95%. With both rates and prices considerably higher, the median mortgage payment is now more than 20% higher than it was a year ago. Perhaps the most disappointing report was the worse-than-expected drop in consumer confidence for March, which also showed that 32% of consumers expect their overall financial position to worsen in the year ahead, which is the highest level since the survey started in the mid-1940s. Overall, the economy looks to be slowing yet is still expanding. Rising rates, persistent inflation, and the Russia-Ukraine conflict are all hurdles to watch, but the broad fundamental conditions still support further economic expansion. The recent rally in stocks is likely a reflection of this, but markets are expected to remain choppy with all the financial, economic, and geopolitical crosscurrents out there.
Chart of the Week
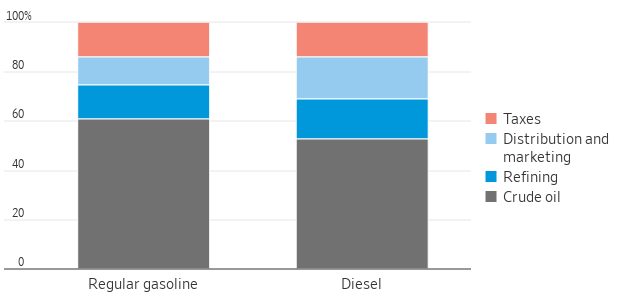
Lawmakers across the U.S. are pushing to pause the collection of gasoline taxes to give drivers a temporary break at the pump as fuel costs hover near record highs. Maryland and Georgia are temporarily cutting state gasoline taxes as fuel prices have surged worldwide amid Russia’s invasion of Ukraine. California is considering giving drivers a $400 rebate to help cushion the blow of high gasoline prices. Lawmakers in Illinois, Massachusetts, Maine, Michigan, Minnesota, New York, and Tennessee are also weighing whether to suspend their state taxes on gasoline. As summer driving season approaches, average prices for regular gasoline have been at record highs the past two weeks after going up for 11 straight weeks. According to weekly figures from the U.S. Energy Information Administration, prices reached $4.32 a gallon on March 14 and were $4.24 according to figures released on March 21.
Taxes account for about 14% of a gallon of fuel
Cost breakdown for a gallon of regular gasoline and diesel
Note: Based on retail prices in February 2022
Source: U.S. Energy Information Administration
Economic Review
- The preliminary March S&P Global U.S. Manufacturing PMI Index rose to 58.5 from an unrevised 57.3 in February, beating expectations for a decline to 56.6. The preliminary S&P Global U.S. Services PMI Index also unexpectedly rose to 58.9 from 56.5 in February and was well ahead of expectations for a dip to 56.0. Readings above 50 denote economic expansion.
- The March Kansas City Fed Manufacturing Activity Index unexpectedly expanded further (a reading above zero) as it rose to 37 from an unrevised 29 in February, well above forecasts of a decline to 26.
- The March Richmond Fed Manufacturing Activity Index remained at expansion levels (a reading above zero), rising to 13 from 1 in February, well above forecasts of 2. New orders, capacity utilization, shipments, and order backlogs all rose and are out of the negative territory.
- The February Chicago Fed National Activity Index (CFNAI), an index of 85 monthly national indicators that tracks overall economic activity and inflationary pressures, fell to 0.51 from the prior month’s 0.59 (revised down from 0.69) but beat expectations of 0.50 and remains firmly in economic expansion territory (above zero).
- February Durable Goods Orders fell -2.2%, more than double the estimated -0.6% decrease and far below January’s unrevised +1.6% gain. Excluding transportation, Durable Goods Orders fell -0.6% for the month, well below forecasts of +0.5% and +0.8% in January. The weakness follows on the heels of a solid January report despite the effects of the Omicron variant. The weakness reflects some natural slowing, but it is too early to know if it is the start of a downward trend.
- February Pending Home Sales unexpectedly fell by -4.1%, far below estimates for a +1.0% gain and January’s downwardly revised -5.8% drop. Sales tumbled -5.4% year-over-year, versus forecasts of a 2.2% decrease, on the heels of January’s negatively-adjusted 9.2% decline. Pending home sales reflect contract signings and are a gauge of the pipeline of existing home sales.
- February New Home Sales unexpectedly plunged to 772,000, far below expectations for a rise to 810,000. January sales were revised down to 778,000 from the initial estimate of 801,000. Rising mortgage rates and construction costs are making new homes less affordable.
- The March final University of Michigan Consumer Sentiment Index was unexpectedly revised lower to 59.4, from the preliminary 59.7 figure, where it was expected to remain. The downward revision came as both the expectations and current conditions components of the survey were adjusted lower. The 1-year inflation forecast increased to 5.4% compared to 4.9% the prior month. Inflation appears to be denting sentiment, as the report showed that 32% of consumers expect their overall financial position to worsen in the year ahead, which is the highest level since the survey started in the mid-1940s.
- Weekly unemployment claims fell unexpectedly by 28,000 to 187,000 versus estimates of 210,000 and the prior week’s downwardly revised 215,000. Continuing claims, a proxy for the total number of people on unemployment rolls through regular state programs, fell by 67,000 to 1,350,000, below estimates of 1,400,000. That put jobless claims at the lowest level since early September 1969 and continuing claims at the lowest level since January 1970.
The Week Ahead
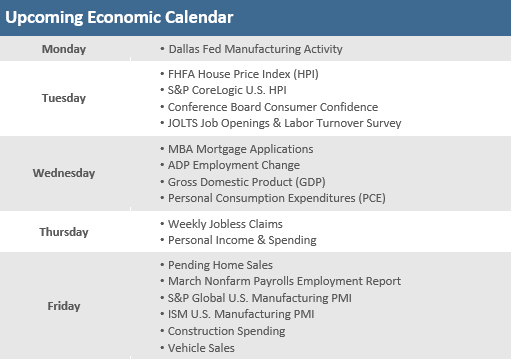
After a couple of weeks of relatively light economic calendars, next week’s calendar gets busier and may help shed some light on whether the economy can withstand the anticipated aggressive Fed tightening. The week starts slowly with the Conference Board’s Consumer Confidence report, job openings (JOLTS), and some home price indices on Tuesday. However, the back half of the week heats up and will likely command attention with Thursday’s February personal income and spending report and jobless claims for the week ended March 26. A very busy Friday brings the ISM and S&P Global Manufacturing PMIs and the March nonfarm payrolls employment report. There are also a few Fed official speeches during the week.
Did You Know?
“TIME IN” vs. “TIMING” – Here are the splits between “up” and “down” time periods for the S&P 500 index from 1950 to the end of 2021, i.e., the last 72 years, as measured by: Days: 54% up and 46% down; Months: 61% up, 39% down; Quarters: 67% up, 33% down; Years: 74% up, 26% down; 5-Year Rolling Time Periods: 79% up, 21% down; and finally 10-Year Rolling Time Periods: 89% up, 11% down. The S&P 500 is a market value-weighted index representing large-capitalization U.S. stocks (source: BTN Research).
IT WAS TIME – The U.S. Federal Reserve increased short-term interest rates on Wednesday, 3/16/2022, raising the federal funds rate to a target range of 0.25% to 0.50%. From 8/15/1979 to 3/18/1980, the Fed, under Paul Volcker’s leadership, raised the fed funds rate from 11% to 20% to eradicate the double-digit inflation the U.S. was experiencing at that time (source: Federal Reserve, BTN Research).
ECONOMIC REBOUNDS – 2020 was just the 10th year in the last 72 years, i.e., 1950-2021, that the U.S. economy contracted. Our economy has rebounded the following year with positive growth 8 out of 10 times, including +5.7% growth in 2021 following the -3.5% contraction in 2020 (source: Commerce Department, BTN Research).
This Week in History
Dot Com Bubble – On March 24, 2000, the S&P 500 reached its dot-com bubble peak. The Dow hit its dot-com era peak in January 2000, but the Nasdaq and the S&P 500 didn’t top out until March. The S&P 500 hit an intraday high of 1,552.87 on March 24. Over the next two years, the S&P 500 dropped -24.8%, but it held up relatively well compared to the -62.7% drop in the tech-centric Nasdaq. Following its March 2000 peak, the S&P 500 wouldn’t make new all-time highs again until 2007. However, it fared much better than the Nasdaq, which wouldn’t surpass its dot-com bubble peak until 2015. Twenty-two years later, from the day of its dot-com peak through 3/25/2022, the S&P 500 index has had about a +353% total return with dividends reinvested, or about +7.1% annualized (source: Benzinga, Bloomberg).
Asset Class Performance
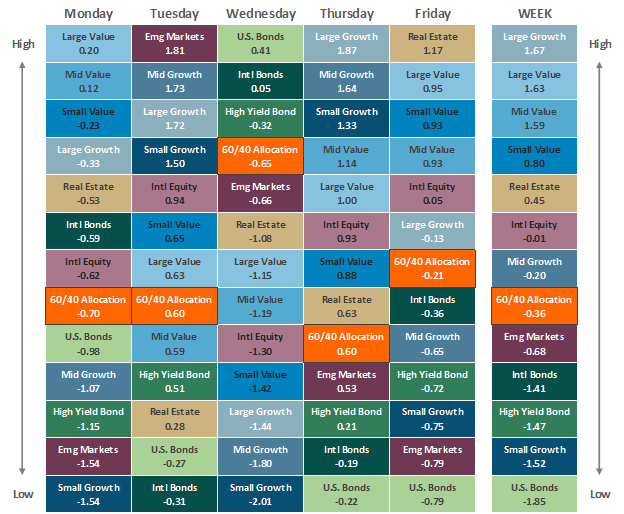
The Importance of Diversification. Diversification mitigates the risk of relying on any single investment and offers a host of long-term benefits, such as lowering portfolio volatility, improving risk-adjusted returns, and helping investments to compound more effectively.
Source: Bloomberg. Asset‐class performance is presented by using market returns from an exchange‐traded fund (ETF) proxy that best represents its respective broad asset class. Returns shown are net of fund fees for and do not necessarily represent the performance of specific mutual funds and/or exchange-traded funds recommended by The Retirement Planning Group. The performance of those funds may be substantially different than the performance of the broad asset classes and to proxy ETFs represented here. U.S. Bonds (iShares Core U.S. Aggregate Bond ETF); High‐Yield Bond (iShares iBoxx $ High Yield Corporate Bond ETF); Intl Bonds (SPDR® Bloomberg Barclays International Corporate Bond ETF); Large Growth (iShares Russell 1000 Growth ETF); Large Value (iShares Russell 1000 Value ETF); Mid Growth (iShares Russell Mid-Cap Growth ETF); Mid Value (iShares Russell Mid-Cap Value ETF); Small Growth (iShares Russell 2000 Growth ETF); Small Value (iShares Russell 2000 Value ETF); Intl Equity (iShares MSCI EAFE ETF); Emg Markets (iShares MSCI Emerging Markets ETF); and Real Estate (iShares U.S. Real Estate ETF). The return displayed as “Allocation” is a weighted average of the ETF proxies shown as represented by: 30% U.S. Bonds, 5% International Bonds, 5% High Yield Bonds, 10% Large Growth, 10% Large Value, 4% Mid Growth, 4% Mid Value, 2% Small Growth, 2% Small Value, 18% International Stock, 7% Emerging Markets, 3% Real Estate.
Chris Bouffard is CIO of The Retirement Planning Group (TRPG), a Registered Investment Adviser. He has oversight of investments for the advisory services offered through TRPG.
Disclaimer: Information provided is for educational purposes only and does not constitute investment, legal or tax advice. All examples are hypothetical and for illustrative purposes only. Past performance of any market results is no assurance of future performance. The information contained herein has been obtained from sources deemed reliable but is not guaranteed. Please contact TRPG for more complete information based on your personal circumstances and to obtain personal individual investment advice.


