Quick Takes
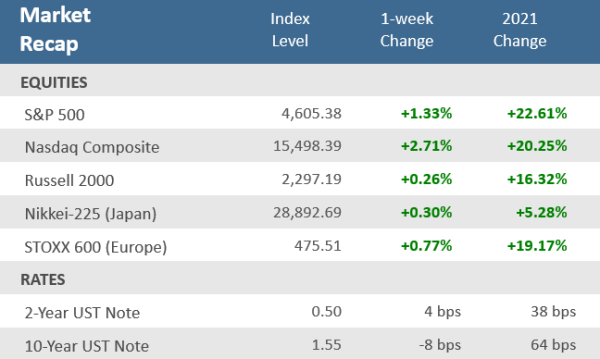
- The October rebound never relented, with the S&P 500 ending with four consecutive weeks of gains and closing the month at another record high. It was the best month for the index since November 2020. The Nasdaq Composite and Dow Jones Industrial Average also finished at all-time highs.
- After rising in eight of the last nine weeks, the yield on the U.S. 10-year Treasury fell by eight basis points, its biggest weekly decline since July 2. Meanwhile, the yield on the U.S. 2-year Treasury note rose four basis points higher to its highest level since March 2020. The Bloomberg Barclays US Aggregate Bond Index gained +0.5% for the week, its best week since July 2.
- Economic reports were mixed with jobless claims dropping to a new post-pandemic low for the third week in a row. The U.S. economy decelerated to 2%, the slowest GDP rate since the 2020 recession. Meanwhile, using the Fed’s preferred measure of Core PCE, inflation tied the prior month’s 30-year high rate of +3.6%.
Markets hit new record highs despite economic growth slowing
U.S. stocks closed at record highs again on Friday to close the week with healthy gains and capping the best month of performance since November 2020. The S&P 500 and Nasdaq Composite indices and the Dow Jones Industrial Average all closed at all-time highs. That’s the 59th all-time high for the S&P 500 this year. It needs 19 more to break the record of 77 in 1995. Strong earnings results and continued decreases in coronavirus cases has helped keep stocks advancing. Despite disappointing earnings from market leaders Apple and Amazon, the bulk of earnings continue to flourish. With more than half of S&P 500 companies reported now, 82% of them are beating Wall Street estimates at a 36% growth rate, which is well ahead of the 28% growth rate expected just a month ago.
On the COVID front, the seven-day average of new confirmed coronavirus cases continues to trend lower in the U.S. with the average down to approximately 73,000 cases a day from a peak of around 165,000 cases a day at the end of August. The Treasury market was really mixed throughout the week. The yield on the U.S. 2-year note rose four basis points higher, while the yield on the benchmark U.S. 10-year note dropped eight basis points lower, meaning the yield curve flattened. It was the largest one-week flattening since June 2020 and the 2-year yield is now at its highest level since March 2020. The rise in short-duration bonds seems to be signaling that investors expect the Fed to hike rates sooner than expected due to inflation. Meanwhile, concerns that a policy mistake by the Fed could derail the economy may have contributed to the drop in the longer maturity yields. Currently, the yield on the 30-year Treasury has actually dropped below the yield on the 20-year maturity. Turning to economic data, the U.S. economy decelerated to 2%, the slowest GDP rate since the 2020 recession. Inflations, using the Fed’s preferred measure of Core PCE, tied the prior month’s 30-year high rate of +3.6%. Weekly jobless claims unexpectedly fell to another pandemic low. Home prices and new home sales continue to rise.
Chart of the Week
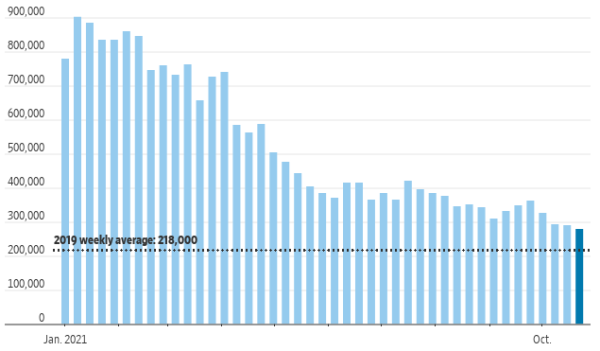
U.S. unemployment claims fell more than expected last week to a fresh pandemic-era low of 281,000, below the 289,000 estimate and below the revised 291,000 a week earlier. That marks the third week in a row jobless claims have been under 300,000, helping the four-week average to also drop under 300,000, at 299,250 – a new post-pandemic milestone. Layoffs are decreasing while record numbers of workers are quitting their jobs, a demonstration of worker confidence in the labor market. Workers who leave their jobs voluntarily don’t qualify for unemployment benefits, and therefore don’t show up in claims figures.
Jobless Claims nearing pre-pandemic levels
Filings for unemployment benefits since the start of 2021
Initial jobless claims, weekly
Source: US. Employment and Training Administration via St Louis Fed, The Wall Street Journal.
Economic Review
- The first look (of three) at Q3 Gross Domestic Product (GDP) showed quarter-over-quarter annualized growth of 2.0%, versus expectations of 2.6% and compared to an unrevised 6.7% increase in Q2. That marks the slowest increase in GDP since the end of the 2020 recession. A deceleration in consumer spending and residential investment helped keep the number lower due primarily to a surge in Delta variant cases of Covid-19 and deepening supply bottlenecks affecting goods from autos to food. Consumer Spending, which makes up 69% of the U.S. economy, rose by just +1.6%, above forecasts of +0.9% but far below the unadjusted +12.0% increase in Q2.
- Inflation hit a 30-year high as measured by the Fed’s favorite gauge, Core Personal Consumption Expenditure (PCE), which was +3.6% for the last 12 months, matching August’s level. Headline inflation, including food and energy, rose at a +4.4% annual rate in September, the fastest since 1991. The headline inflation rate was pushed by a +24.9% increase in energy costs and a +4.1% gain in food. Employment costs rose more than expected and at the fastest annual pace in 19 years.
- The October final reading of the University of Michigan Consumer Sentiment Index was unexpectedly revised higher to 71.7, compared to expectations for it to be unadjusted at the preliminary reading of 71.4, but was lower than September’s 72.8.
- The preliminary September read for new orders of Durable Goods (products meant to last at least three years, such as appliances, computers, and cars) fell -0.4% in September, the first drop since spring, but still ahead of economists’ forecast for a -1.1% decline. Manufacturers continue to confront higher material costs and parts and labor shortages. In a positive sign, businesses continued to step up spending on machinery and other projects that could make them more efficient in the long run. New orders for nondefense capital goods excluding aircraft rose +0.8%, the eighth straight monthly gain.
- September New home sales rose +14.0% from August to an annual rate of 800,000 units, above expectations of 756,000. The median home price jumped +18.7% from last year to a record $408,800. New home inventory remained unchanged at August’s level of a 5.7-months supply. Sales over previous month rose in all regions except in the Midwest, but sales in all the major regions were solidly lower compared to the same period a year ago, except the Northeast.
- The S&P CoreLogic Case-Shiller Home Price Index 20-city composite showed a +19.67% year-over-year rise in August, slightly below estimates, but matching July’s record level. Compared to the prior month, home prices were up +1.2% on a seasonally adjusted basis, compared to forecasts of a +1.5% gain. Phoenix had the fastest home-price growth in the country for the 27th straight month, at +33.3% A separate measure of home-price growth by the Federal Housing Finance Agency (FHFA) showed a +18.5% increase in home prices in August from a year ago.
- The Conference Board’s Consumer Confidence Index increased to 113.8 in October from an upwardly revised 109.8 in September, beating estimates for a decline to 108.3. It’s the first increase in three months, with both the Present Situation Index portion of the survey and the Expectations Index (of business conditions for the next six months) rising. Short-term inflation concerns rose to a 13-year high, but consumers indicated they planned to spend on big-ticket items in the final quarter of this year.
- The Chicago Fed National Activity Index (CFNAI), an index of 85 national economic indicators produced by the Federal Reserve Bank of Chicago, grew at a below-average pace in September, due to a decline in production-related sectors such as manufacturing. The gauge fell to -0.13, (negative readings correspond to below-trend growth) well below expectations of 0.35 and 0.05 in August.
- The Dallas Fed Manufacturing Survey showed that Texas factory output improved in October, rising to 14.6 from 4.6 in September and well above expectations for a gain of 6.0. The Richmond Fed Manufacturing Activity Index moved back to expansion levels (a reading above zero) with a rise to 12 from -3 in September, and versus forecasts for an increase to 5.
The Week Ahead
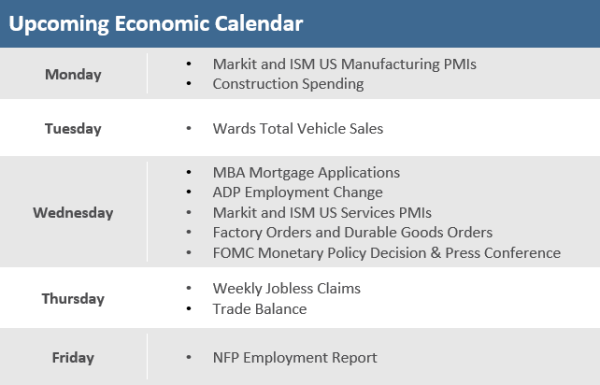
This week’s economic calendar isn’t quite as heavy as last week’s but will still see some important reports. Markit and ISM will release their respective Purchasing Managers Indices (PMIs) that will provide some indications of economic activity going into October. The Fed’s monetary policy decision is on Wednesday when it is expected to unveil its plans to begin tapering its monthly asset purchases. Friday is the October employment report, in which employment growth is expected to accelerate to a 400,000 gain following September’s disappointing 194,000.
Did You Know?
HOLIDAY DELAY — The Retail Industry Leaders Association has already cautioned that vaccination or testing mandates could trigger staffing problems ahead of the holiday season, while the National Retail Federation and U.S. Chamber of Commerce are asking to delay its implementation until January at the earliest. 30% of unvaccinated workers said they would leave their jobs rather than comply with a vaccination or testing mandate, according to vaccine data analysis firm KFF. Another 56% said they would get tested weekly, while 12% said they would get the shot. The Retail Industry Leaders Association concerns come after a record 4.3M workers quit their jobs in August, the highest turnover in 20 years (Source: Seeking Alpha, KFF).
FLU, WHERE ARE YOU? — 35 million Americans got the flu during the 2019-2020 flu season, i.e., November 2019 through May 2020. Just 2,000 Americans got the flu during the 2020-2021 flu season (source: The Atlantic, BTN Research).
DOUBLE IN THIRTY YEARS — It would take $1,999 in September 2021 to have the same purchasing power as $1,000 in September 1991 (Source: CPI Inflation Calculator, Bureau of Labor Statistics, BTN Research).
This Week in History
This week in the year 1822, in the heat of the earliest frenzy for investing in emerging markets, the 6% bonds of the Kingdom of Poyais, near Nicaragua, traded at 81.5% of their par value on the London Stock Exchange, just behind Chile (at 84% of par). Unfortunately, Poyais was a fictitious country fabricated by a Scottish scamster, Gregor MacGregor, and the bonds soon turned out to be worthless (Source: The Wall Street Journal).
Asset Class Performance
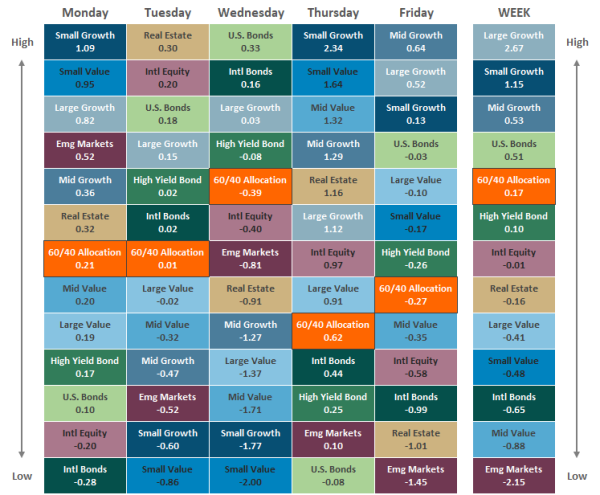
The Importance of Diversification. Diversification mitigates the risk of relying on any single investment and offers a host of long-term benefits, such as lowering portfolio volatility, improving risk-adjusted returns, and helping investments to compound more effectively.
Source: Bloomberg. Asset‐class performance is presented by using market returns from an exchange‐traded fund (ETF) proxy that best represents its respective broad asset class. Returns shown are net of fund fees for and do not necessarily represent the performance of specific mutual funds and/or exchange-traded funds recommended by The Retirement Planning Group. The performance of those funds may be substantially different than the performance of the broad asset classes and to proxy ETFs represented here. U.S. Bonds (iShares Core U.S. Aggregate Bond ETF); High‐Yield Bond (iShares iBoxx $ High Yield Corporate Bond ETF); Intl Bonds (SPDR® Bloomberg Barclays International Corporate Bond ETF); Large Growth (iShares Russell 1000 Growth ETF); Large Value (iShares Russell 1000 Value ETF); Mid Growth (iShares Russell Mid-Cap Growth ETF); Mid Value (iShares Russell Mid-Cap Value ETF); Small Growth (iShares Russell 2000 Growth ETF); Small Value (iShares Russell 2000 Value ETF); Intl Equity (iShares MSCI EAFE ETF); Emg Markets (iShares MSCI Emerging Markets ETF); and Real Estate (iShares U.S. Real Estate ETF). The return displayed as “Allocation” is a weighted average of the ETF proxies shown as represented by: 30% U.S. Bonds, 5% International Bonds, 5% High Yield Bonds, 10% Large Growth, 10% Large Value, 4% Mid Growth, 4% Mid Value, 2% Small Growth, 2% Small Value, 18% International Stock, 7% Emerging Markets, 3% Real Estate.
Chris Bouffard is CIO of The Retirement Planning Group (TRPG), a Registered Investment Adviser. He has oversight of investments for the advisory services offered through TRPG.
Disclaimer: Information provided is for educational purposes only and does not constitute investment, legal or tax advice. All examples are hypothetical and for illustrative purposes only. Past performance of any market results is no assurance of future performance. The information contained herein has been obtained from sources deemed reliable but is not guaranteed. Please contact TRPG for more complete information based on your personal circumstances and to obtain personal individual investment advice.


